NEUBrew Product Displays

UV Index - Erythema UV Irradiance UV Scans Ozone Time Series Ozone Vertical Profiles


UV Instantaneous Index and Daily UV Erythemal Dose Time Series

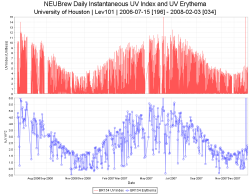
Brewer UV Instantaneous Index and Daily UV Erythema Time Series allow plot durations ranging a single day to multiple years. The top-right plot is an example of UV Data spanning more than a year, allowing observation of yearly cyclic variability in UV data.

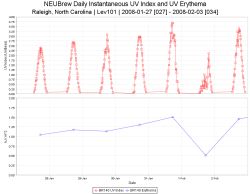
The bottom-right plot is an example that spans seven days, allowing observation of the variability of instantaneous UV Index measurements. A cloud-free day will produce a smooth UV Index curve. Days with various cloud passages will produce a less consistent daily UV Index curve.

By default, the data points of the UV Instantaneous Index are disabled. For shorter duration plots, points can be enabled to provide a visual marker for the number and distribution of UV Index measurements during the day.

Comparison of UV Index and Erythema with co-located Yankee UVB-1 instruments can be enabled by "Checking" the Broadband UV Check Box on the user interface for this plot.

Daily UV Index and UV Erytheam Long-Term Plot
Daily UV Index and UV Erytheam Week-Long Plot

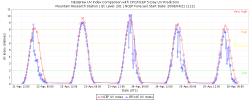
CPC/NCEP UV Forecast Prediction Comparison with NEUBrew UV Index

CPC/NCEP is generating Daily 5-Day UV Prediction Forecasts for the NEUBrew Network station locations. The plot to the right is an example of the UV comparison with CPC/NCEP forecasts. NCEP UV data units are converted to index values by dividing the NCEP units by 25. For information about how CPC/NCEP generates UV predictions see the CPC/NCEP web site.

5-Day Comparison of CPC/NCEP UV Forecasts to NEUBrew UV Index

UV Irradiance Data

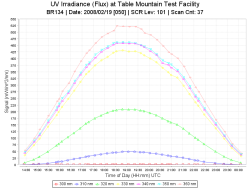
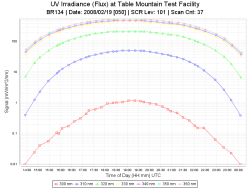
Brewer UV Irradiance plotted as a daily time series. Seven discrete wavelengths are plotted separately, 300nm - 360nm in 10nm increments. The default time span for plotting is the latest day. Start and End times spanning several days or weeks will result in multiple daily images being generated in one browser window. The Y-Axis can be plotted using Linear or Log scales.

Daily UV Irradiance Data (Linear Scale) Daily UV Irradiance Data (Log Scale)

UV Spectral Scan Data

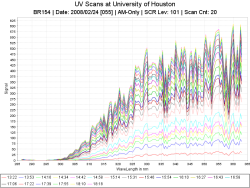
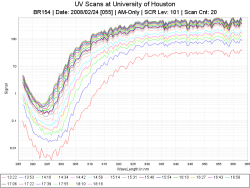
Brewer Daily UV Spectral Scan overlays multiple UV scans for a single day. Scans can be filtered for AM-Only, PM-Only, or both AM/PM scans. The default time span for plotting is the latest day. Start and End times spanning several days or weeks will result in multiple daily images being generated in one browser window. The Y-Axis can be plotted using Linear or Log scales.

Daily UV Scan Data (Linear Scale) Daily UV Scan Data (Log Scale)

Station Ozone Time Series with optional Comparison to OMI Satellite Data

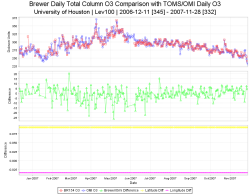
Brewer Daily Total-Column Ozone Time Series with the option to plot against TOMS/OMI Ozone Level 3e satellite data. Ozone ratios and/or differences can be plotted as well as differences in latitude and longitude between the Brewer and closest OMI satellite ozone reading. Latency of the Brewer data should be one day. Latency of the latest OMI data can vary depending on external processing.

Daily Ozone Comparison with TOMS/OMI Data

Instrument Ozone or Sulfur Dioxide Time Series Comparison Display

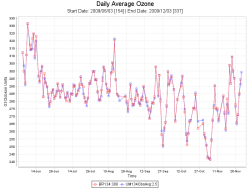
Ozone Time Series Comparison interface allows the user to plot any combination of instruments and QC Levels data against one another. Brewer Direct-Sun ozone or sulfur dioxide, UmKehr Derived Total Column Ozone, and OMI Observations are supported. Averaging and Standard Deviation of ozone/sulfur dioxide from two or more instruments is possible. Difference and ratio of ozone from two instruments is also possible. A single display panel is generated for each request.

Ozone Comparison Time Series

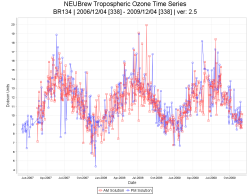
Tropospheric Ozone Time Series Display

Tropospheric Ozone values are derived from the Umkehr Vertical Profile dataset. AM and PM time series are extracted from the corresponding vertical profiles. In this example plot, ozone values from a three year period are represented.

Ozone Comparison Time Series

Daily Ozone Vertical Profiles and Umkehr N-Values

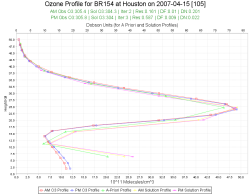
Ozone vertical profiles derived from Umkehr scans. AM/PM O3 profiles are plotted, if they exist. The higher resolution data are interpolated from the Solution Profiles. Good AM/PM profile sub-title text is color coded GREEN. Bad AM/PM profile sub-title text is color coded RED. AM/PM profiles are considered "good" if their iterations (Iter) < 4 and Residuals (Res) <= 1.0. Color coding of the sub-titles are unrelated to the colors used to render plot traces.

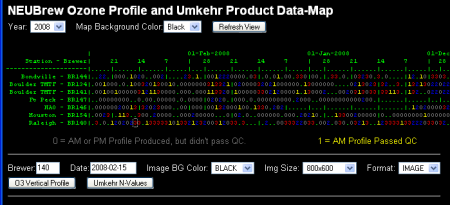
Latency of the latest O3 profile and Umkehr data should be 24 hours. The oldest data available dates to approximately August 2006. Use the Ozone Profile and Umkehr Data-Map to locate and select O3 Profile plots or Umkehr Daily Summaries. Data can be rendered in graphic or text format.

Daily ozone Vertical Profile Display Sample
Ozone Profile and Umkehr Data Map Display Sample

Current versions of the Umkehr Ozone Vertical Profile data are generated using O3BUmkehr.exe, a program developed by Martin Stanek of chmi.cz in collaboration with Irina Petropavlovskikh of NOAA/CIRES. O3BUmehr.exe is Windows based software, the latest program is version 2.5 and is available for download from http://www.o3soft.eu/o3bumkehr.html. Version 2.5 provides R6 Correction for the re-calculation of Total Column Ozone. In version 2.5, we also apply our Ozone Level 300 Langley derived ETC (Extra-Terrestrial Constant) offset to the baseline ETC.

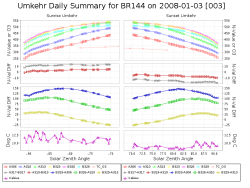
Umkehr Daily Summary Display Sample