Pacific Decadal Oscillation (PDO)
Overview
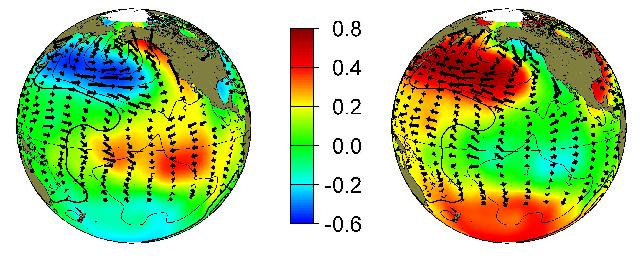
The Pacific Decadal Oscillation (PDO) is often described as a long-lived El Niño-like pattern of Pacific climate variability (Zhang et al. 1997). As seen with the better-known El Niño/Southern Oscillation (ENSO), extremes in the PDO pattern are marked by widespread variations in the Pacific Basin and the North American climate. In parallel with the ENSO phenomenon, the extreme phases of the PDO have been classified as being either warm or cool, as defined by ocean temperature anomalies in the northeast and tropical Pacific Ocean. When SSTs are anomalously cool in the interior North Pacific and warm along the Pacific Coast, and when sea level pressures are below average over the North Pacific, the PDO has a positive value. When the climate anomaly patterns are reversed, with warm SST anomalies in the interior and cool SST anomalies along the North American coast, or above average sea level pressures over the North Pacific, the PDO has a negative value.
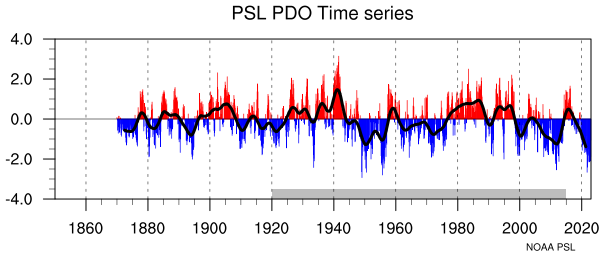
Latest Ensemble PDO Value: -1.17
Plots & Data
PDO patterns and time series from various SST datasets. See the 'Resources' tab for links to the datasets and the code used to plot these images.
References
Mantua, N.J., S. R. Hare, Y. Zhang, J. M. Wallace, and R. C. Francis, 1997: A Pacific Interdecadal Climate Ooscillation with Impacts on Salmon Production. Bull. Amer. Meteor. Soc., 78, 1069-1079.
Newman, M., M. A. Alexander, T. R. Ault, K. M. Cobb, C. Deser, E. Di Lorenzo, N. J. Mantua, A. J. Miller, S. Minobe, H. Nakamura, N. Schneider, D. J. Vimont, A. S. Phillips, J. D. Scott, and C. A. Smith, 2016: The Pacific Decadal Oscillation, Revisited. J. Clim., DOI: 10.1175/JCLI-D-15-0508.1
Resources
Datasets
The original datasets used to create the PDO EOFs and Timeseries are available at the links below.
Related Links
- NCAR's PDO: Definition and Indices Page
- NCEI's PDO Page
- ERDAP PDO access