TexAQS 2006 TOPAZ Lidar data
August 31 - Final Data
| Previous Flight | Archive Calendar | Next Flight |
|---|
Flight #17
Takeoff: 12:06 CDT
Total flight time: 6.1 hours
This flight coincided with the highest surface measurements of ozone recorded during August in Houston. Originally, a flight plan was developed based on forecasts that the Houston plume would be drifting to the southwest. After takeoff, profiler winds from LaPorte indicated that the flow was more easterly. As a result, the flight plan was modified to a grid pattern extending to the west. During flight, an axis of high ozone, exceeding 150 ppb, was observed extending from just south of Houston toward the northeast. The plume was embedded in high background ozone extending over the entire region. Ozone was well mixed to a depth of more than 1500 meters. In addition to the primary plume, other plumes were observed south of Houston, presumably from the Texas City petrochemical complex. A comparison with the 13:00 ozone sonde from the University of Houston was obtained during the flight.
Select an image to view full resolution
Ozone Cross-section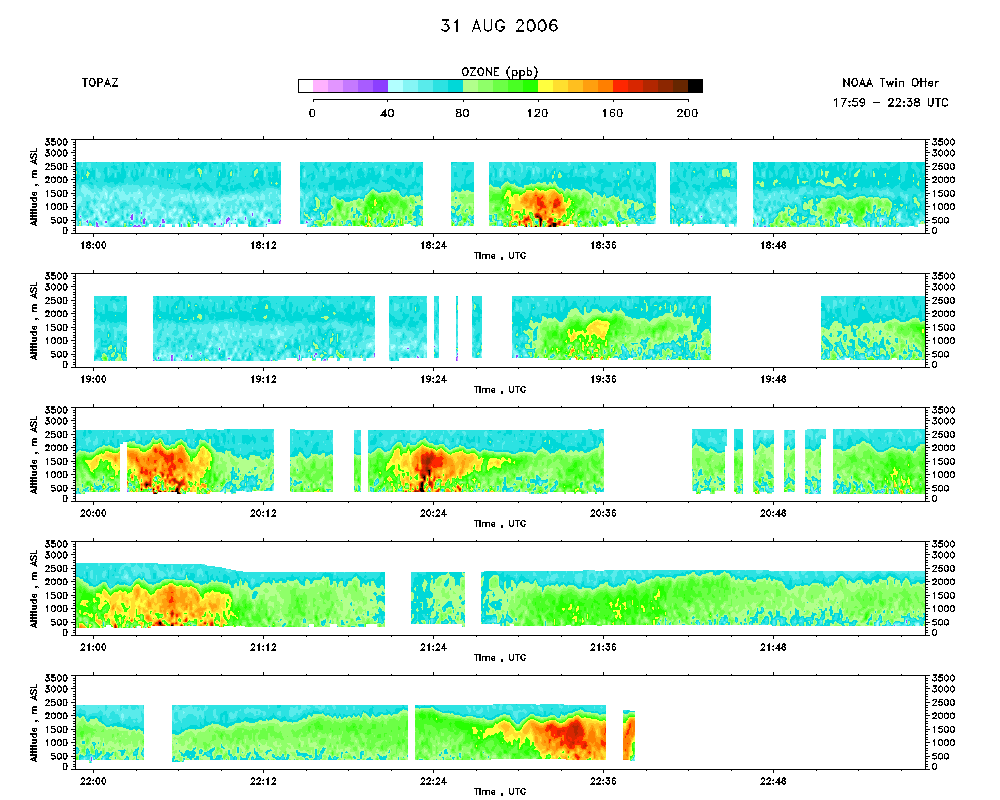 download ICARTT format data (ict file) download simple ASCII data (txt file) |
Aerosol Cross-section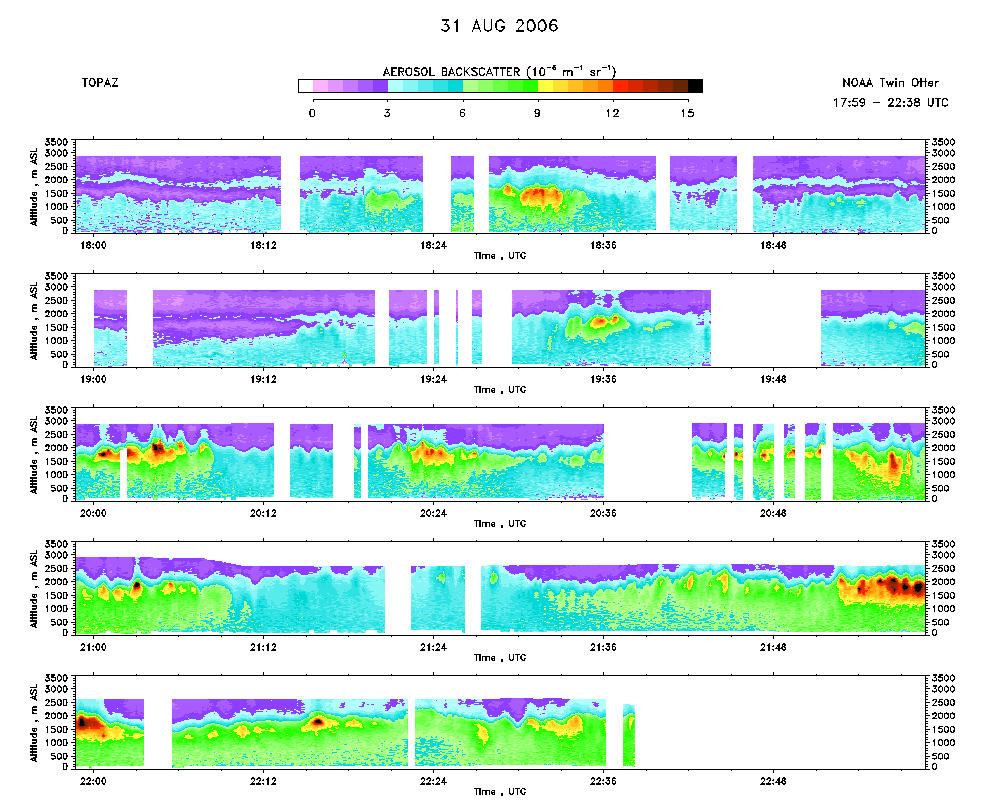 download ICARTT format data (ict file) download simple ASCII data (txt file) |
Ozone Map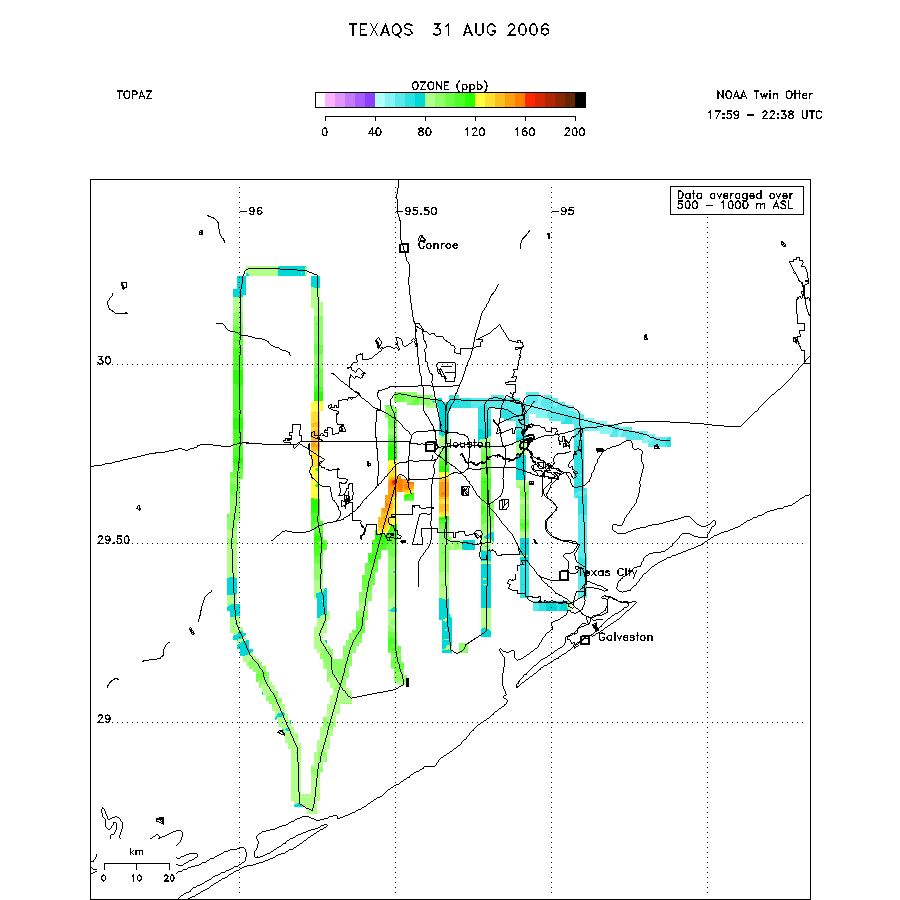 |
Mixed Layer Height Map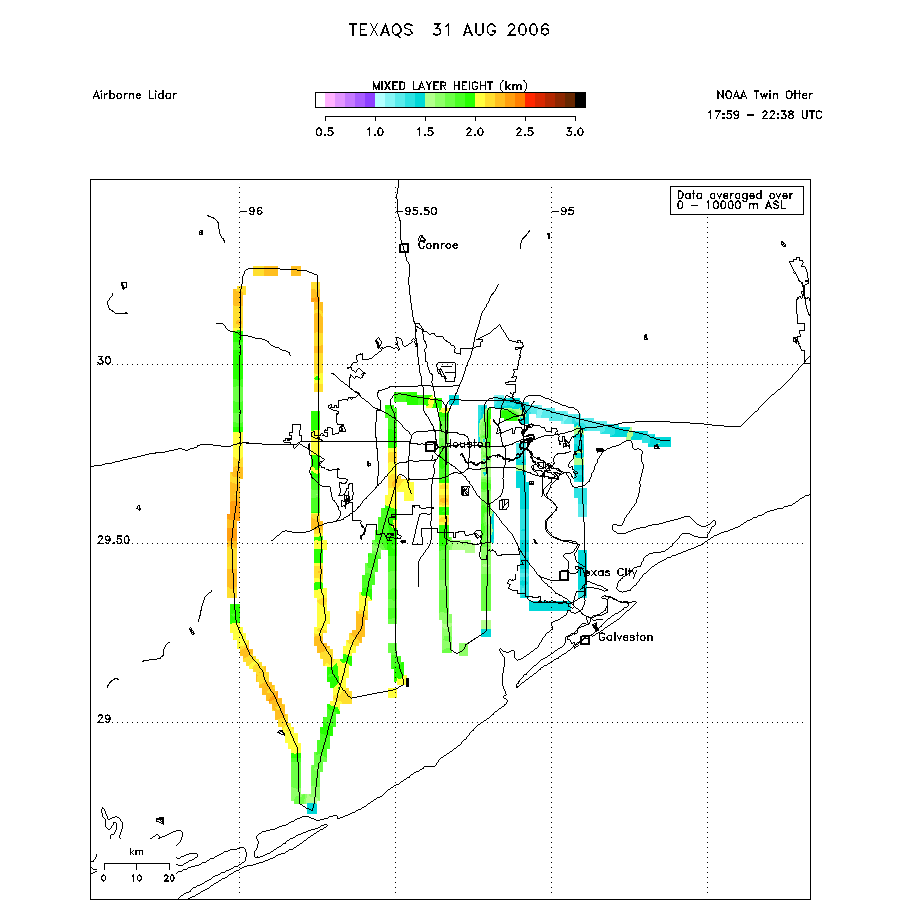 download ICARTT format data (ict file) download simple ASCII data (txt file) |