| Differences | ||||||||
|---|---|---|---|---|---|---|---|---|
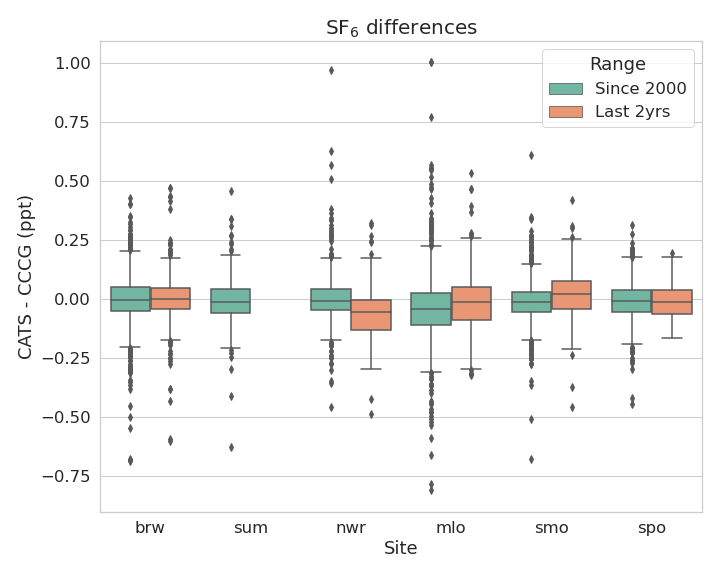
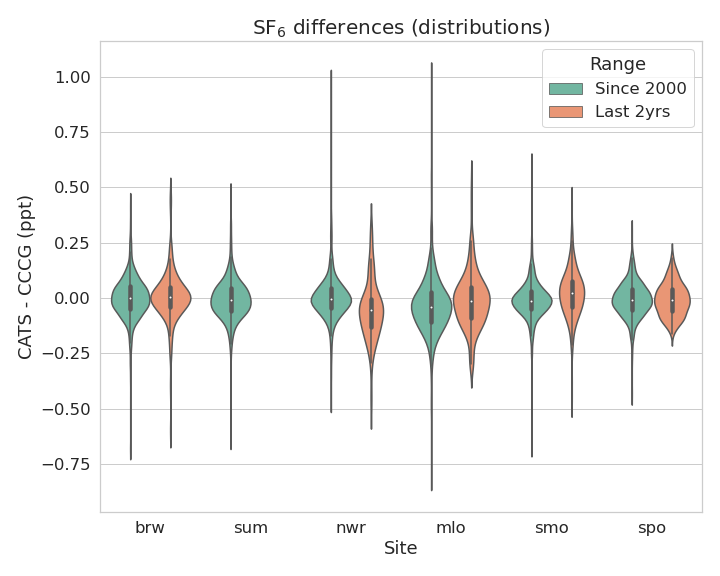
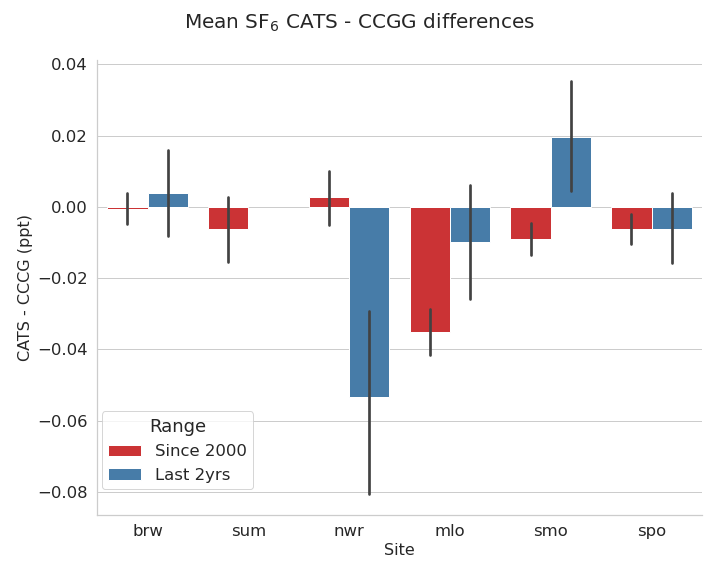
| Site | count | mean | std | min | 25% | 50% | 75% | max |
| brw | 2183 | 0.000 | 0.100 | -0.685 | -0.050 | -0.001 | 0.051 | 0.470 |
| mlo | 2001 | -0.031 | 0.133 | -0.808 | -0.105 | -0.036 | 0.031 | 1.004 |
| nwr | 760 | -0.005 | 0.111 | -0.485 | -0.056 | -0.010 | 0.038 | 0.973 |
| smo | 1511 | -0.008 | 0.103 | -0.803 | -0.052 | -0.009 | 0.036 | 0.612 |
| spo | 1474 | -0.008 | 0.079 | -0.444 | -0.056 | -0.009 | 0.040 | 0.313 |
| sum | 404 | -0.006 | 0.096 | -0.625 | -0.057 | -0.009 | 0.044 | 0.460 |