ppm = µmol mol-1
ppb = nmol mol-1
ppt = pmol mol-1
μX = uncertainty associated with the quantity X
standard uncertainty = approx. 1-sigma, (68% confidence level)
expanded uncertainty = standard uncertainty times a coverage factor, k (k=2 corresponds to
~95% confidence level)
As the WMO/GAW Central Calibration Laboratory, the NOAA Global Monitoring Laboratory provides compressed gas standards (reference materials) for use in atmospheric monitoring of major greenhouse and related gases (CO2, CH4, CO, N2O, and SF6). For each measured mole fraction, we provide two estimates of uncertainty. The first is an estimate of reproducibility, or scale transfer uncertainty. Reproducibility is estimated from analysis of many tertiary standards or other air samples analyzed several months to years apart. This provides an estimate of how well we can maintain calibration scales over time, considering changes in reference cylinders, secondary standards, and analytical methods. Reproducibility is an important parameter in the WMO/GAW community, as it relates to the magnitude of the smallest gradient that can be expected to be determined from measurements calibrated independently. We also provide an expanded uncertainty, which is the total uncertainty associated with a particular calibration scale, and is derived from a propagation of uncertainty following methods outlined in JCGM (2008) (GUM). Both estimates are reported at approximately 2-sigma (coverage factor k=2, ~95% confidence level).
Methods used to estimate expanded uncertainties for calibration scales based on gravimetrically prepared standards are outlined here. Uncertainties for the manometric CO2 scale are discussed separately in Hall et al. (2020). Standard uncertainty represents approximately 68% confidence level (1-sigma, coverage factor k=1), and expanded uncertainty approximately 95% confidence level (2-sigma, coverage factor k=2).
The general method used to estimate the expanded uncertainty associated with value assignment involves 6 steps. Please note that these estimates may change as we learn more about our methods and analytical techniques.
STEP 1: We first determine the standard uncertainty for each primary standard, considering all known elements that contribute to total uncertainty. The gravimetric method involves the dilution of a known mass (aliquot) of a particular gas with a known mass of dilution gas (air). In the uncertainty analysis we consider uncertainties associated with the reagent purity, mass determination, molecular weights, composition of gases used for dilution, and transfer efficiency. To be consistent with JCGM (2008), we consider both type A (statistical) and type B (estimated by other means) variables, and include different distributions, as appropriate. We analyze the oxygen content of synthetic air relative to a NIST O2 standard (SRM-2659a). This results in a standard uncertainty of 0.0048 g/mol on the molecular weight of air. An example for an N2O primary standard prepared gravimetrically is shown in Table 1.
Table 1: Relative contributions to uncertainty of a single N2O primary standard.| Component | Rel. Contribution | Type | Distribution |
|---|---|---|---|
| reagent purity | 13% | B | rectangular |
| MW major component | 1% | B | rectangular |
| MW dilution gas (air) | 10% | B | rectangular |
| transfer efficiency | 3% | B | normal |
| mass determination | 38% | A | normal |
| N2O in dilution gas | 35% | B | rectangular |
| MW is molecular weight | |||
STEP 2: Determine the standard uncertainty associated with a scale defined by N, “independent” primary standards. Here we specify a response function relating instrument response to mole fraction. The response is typically modelled with a linear or polynomial function. We then analyze primary standards relative to a reference cylinder, and determine the parameters of the response function. We use orthogonal distance regression to determine fit coefficients, incorporating uncertainties in both the dependent and independent variables. The standard uncertainty for the response function is determined using curve-fit software, such as Igor Pro or a NIST software package “metRology”, taking into account correlation among coefficients. Another software tool that can be used to estimate uncertainty for a given measurement equation and input variables is available at http://uncertainty.nist.gov/. The NIST tool gives similar results to those described here.
STEP 3: Estimate the uncertainty associated with transferring the scale from primary to secondary, and secondary to tertiary standards. In this case, we use reproducibility as an estimate of scale transfer uncertainty since it is determined over several years under a variety of analytical conditions.
STEP 4: Estimate any additional uncertainty not previously accounted for. Here we consider the independence of primary standards or other variables. When statistical uncertainties dominate the uncertainty budget, we can usually assume independence. In other cases we remove common components and re-calculate the standard uncertainty on each primary standard and repeat step 2. An example of this case is CH4. Most ppb-level CH4 primary standards were prepared from a single gravimetric parent mixture, FF37058 (https://www.esrl.noaa.gov/ccl/ch4_scale.html.) Thus, we only consider uncertainties not inherited from parent mixture FF37058 in the ODR curve fit, and add uncertainties derived from the parent mixture to the curve fit uncertainty in step 5. In the case of CO, we must account for drift in the primary standards, and this introduces a small additional uncertainty. In a third example, we consider the case of SF6, for which SF6 in the dilution gas is a significant component in the uncertainty budget. In this case we cannot treat all primary standards as independent since some (not all) were prepared with the same dilution gas. In that case we follow steps 1-3 and add an additional uncertainty (to account for the uncertainty of SF6 in the dilution gas) in step 5.
STEP 5: Add uncertainties from steps 2-4 in quadrature.
STEP 6: Apply a coverage factor to calculate expanded uncertainty, and approximate the expanded uncertainty as a function of mole fraction using a polynomial function.
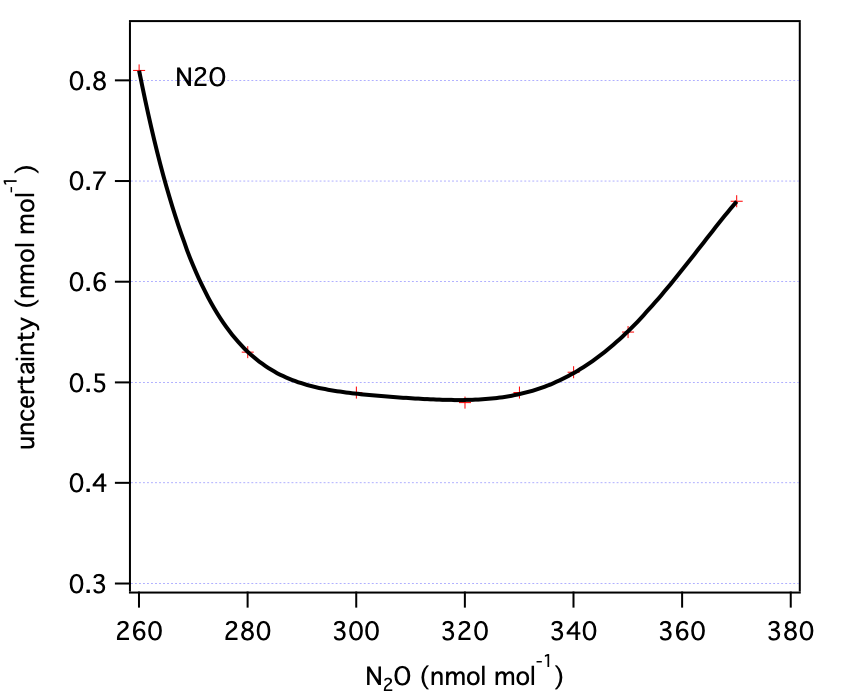
Table 2: N2O uncertainty components as a function of mole fraction (all nmol mol-1).| N2O | u1 | u2 | u3 | total (standard unc) | total (expanded unc) |
|---|---|---|---|---|---|
| 260 | 0.50 | 0.10 | 0.15 | 0.53 | 1.06 |
| 280 | 0.32 | 0.10 | 0.13 | 0.36 | 0.71 |
| 300 | 0.25 | 0.10 | 0.10 | 0.29 | 0.58 |
| 320 | 0.24 | 0.10 | 0.10 | 0.28 | 0.56 |
| 330 | 0.24 | 0.10 | 0.11 | 0.28 | 0.56 |
| 340 | 0.25 | 0.10 | 0.12 | 0.29 | 0.58 |
| 350 | 0.30 | 0.10 | 0.13 | 0.34 | 0.68 |
| 370 | 0.50 | 0.10 | 0.14 | 0.53 | 1.06 |
| Where u1 = standard uncertainty related to primary standards (steps 1,2); u2 = standard uncertainty associated with scale transfer (step 3), and u3 = reproducibility of analysis. | |||||
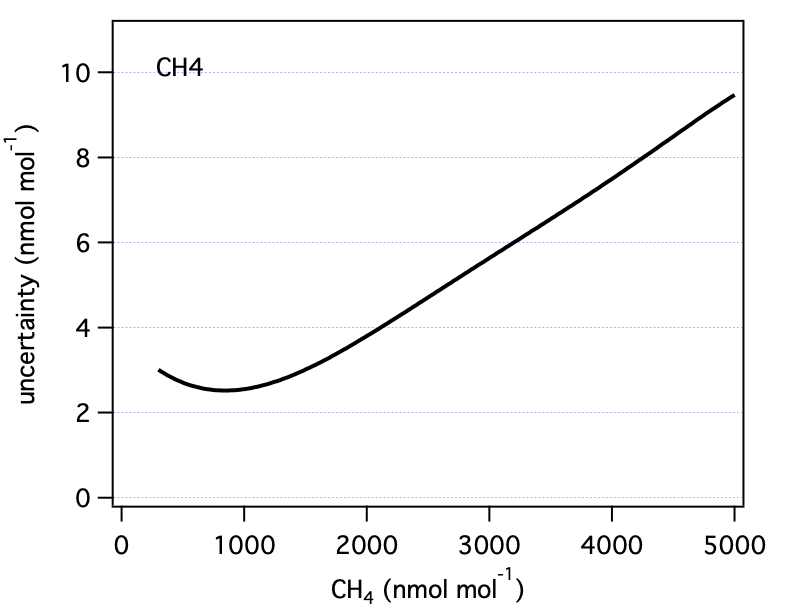
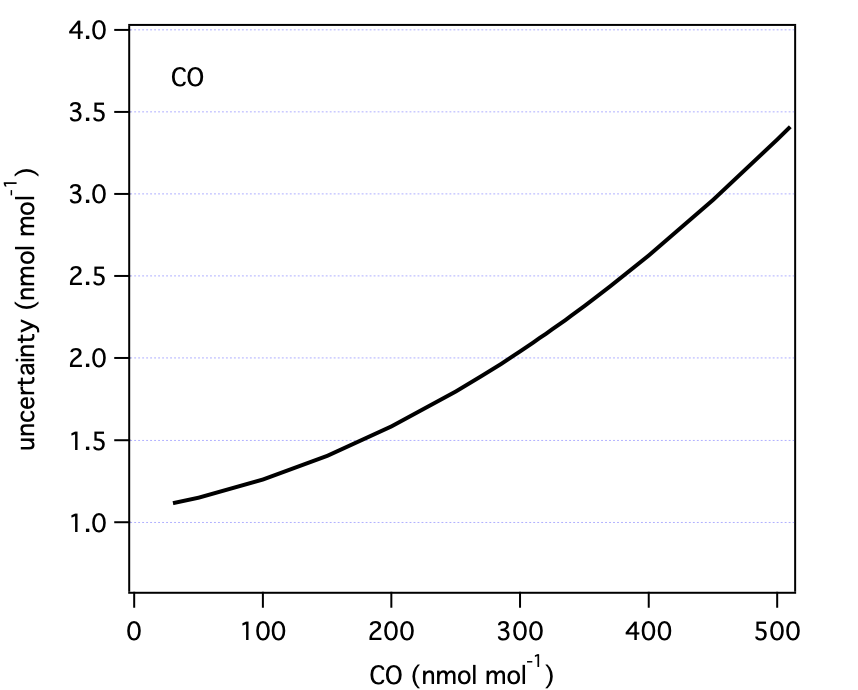
Since the expanded uncertainty for each gas is a function of mole fraction, we use the tools outlined above to calculate the expanded uncertainty at various mole fractions, and approximate the expanded uncertainty over the range of each scale with a polynomial. We employ a linear function for CO2, and 3rd or 4th order polynomials for CH4, N2O, CO, and SF6.
Table 3: Summary of expanded uncertainties for CO2, CH4, CO, N2O, and SF6. CO2 is included here for completeness, but is discussed in a separate document.| Gas | Typical mole fraction | Expanded uncertainty | Unit |
|---|---|---|---|
| CO2 | 400 | 0.17 | ppm |
| CH4 | 1850 | 3.6 | ppb |
| CO | 150 | 1.4 | ppb |
| N2O | 330 | 0.56 | ppb |
| SF6 | 10 | 0.08 | ppt |
Our reporting follows guidelines developed in the Gas Analysis Working Group (GAWG), which align with the other working groups in the Consultative Committee for Amount of Substance in Chemistry and Biology (CCQM). This group organizes comparisons, known as key comparisons, between national metrology institutes and designated institutes to assess the relative agreement for particular metrological quantities (e.g. the amount fraction of a gas in a particular matrix). The GAWG Strategy Document (2019) provides guidance and examples of uncertainty reporting that link specifically to key comparisons carried out by the CCQM/GAWG and requirements for listing claims for Calibration and Measurement Capabilities (CMCs). In some cases, a result obtained during a key comparison influences how uncertainties are reported.
The general rule is that uncertainties must be consistent with those submitted to a key comparison, and must be extrapolated on a relative basis to other mole fractions (within limits). Further, a discrepant result during a key comparison must be considered when reporting uncertainties.
As a CCL, we maintain CMCs for CO2, CH4 and N2O, and we have participated in three relevant key comparisons. These impact our reported uncertainties as follows.
We reported an uncertainty of 0.21 ppm (k=2) at 380 ppm in key comparison K120a. Therefore, we must report uncertainty as 0.21/380 = 0.00055.
μCO2 = 0.055%
During key comparison K82 our sample agreed with the reference value at 1800 ppb, but did not agree with the reference value at 2200 ppb. Therefore, according to the guidelines we must include that discrepancy in our uncertainty reporting for mole fractions above 2200 ppb. We have re-evaluated our uncertainties since K82.
μCH4 = 0.194% for lower scale limit < CH4 < 2200 ppb (3.5/1800 = 0.194%)
μCH4 = 0.46% for CH4 ≥ 2200 ppb (incorporates discrepancy observed in K82 at 2200 ppb)
During key comparison K68, we reported 1 ppb uncertainty at 320 ppm. Therefore, we must report uncertainty as 1/320 = 0.31%.
μN2O = 0.31%
For CO and SF6, we have not submitted CMC claims. For SF6 a key comparison has yet to be conducted. For CO, key comparison K84 was complicated by instability of CO in cylinders and thus does not provide sufficient information to inform on uncertainties. For CO and SF6, we report uncertainties established using bottom-up methods described in section 1.0.
These are our uncertainty estimates as a function of mole fraction derived as outlined in section 1.0 (not accounting for reporting requirements discussed in section 2.0).