
The Data: The Story Told from CO2 Samples
A Mosaic of Stories
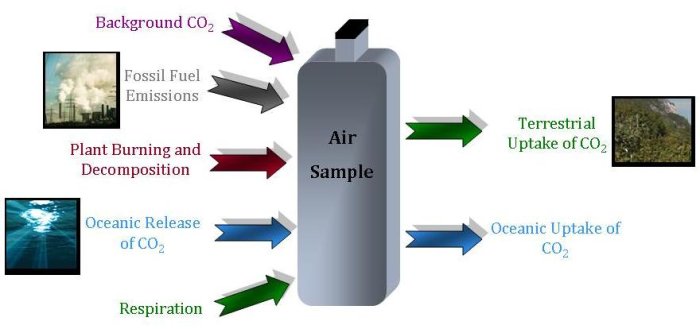
Different sources of carbon dioxide have their own, unique isotopic fingerprints. However, the story of a sample of carbon dioxide becomes more complex when carbon dioxide from many different sources mix together in the atmosphere. While carbon dioxide from the burning of fossil fuels does not have 14C, and carbon dioxide from terrestrial plants has less 13C than from the ocean, an air sample contains carbon dioxide from all of these sources. The story becomes even more complicated because the ratio of isotopes in the mixture also reflects how much atmospheric carbon dioxide is taken up from different sinks. Therefore, an air sample will show the effect of all these different components–each with their unique characteristic isotopic fingerprints.
The Detective Work
NOAA Carbon Cycle and Greenhouse Gases scientists measure the carbon isotopic composition in each air sample. For 14C, this ratio is given as a Δ14C value (pronounced delta 14-cee–the triangle is a capital delta, which is the Greek symbol for a “D”). The smaller the Δ14C value in a measured sample, the fewer 14C atoms is in it, and the more of its carbon dioxide is from fossil fuel emissions.
Similarly, the ratio for 13C is written as δ13C (pronounced delta 13-Cee, and δ is the lowercase “d” in ancient Greek). Smaller δ13C values mean that there are relatively fewer 13C atoms in the sample. The units are ‰, pronounced “permil” for both Δ14C and δ13C.
| CO2 Pool | Δ14C Value (‰) |
δ13C Value (‰) |
|---|---|---|
| Fossil Fuels | -1,000 | -28 |
| Terrestrial Biosphere | +45 | -26 |
| Ocean | +45 | -10 |
| Atmosphere | +45 | -8 |
Learn more about the formula for determining delta values.
The Balancing Act
Just like you (or your parents) have to balance your check book by looking at the amount of money that goes into your account and the amount you spend, atmospheric scientists also have to balance the amount of carbon dioxide in the atmosphere. Using the special isotopic fingerprints for each source, scientists can figure out how much of the carbon dioxide in a sample comes from each individual source.
An Example Calculation…How the Sources Affect the Delta Value
Let's look at an example: Right now (in 2010) the natural atmosphere has about 380 parts per million, or ppm, of CO2, with Δ14C of +45‰. If we add 1 ppm of fossil fuel CO2, with a Δ14C of -1000‰, then the new Δ14C value in the atmosphere is a little bit lower: +42‰. On the other hand, if we instead add 1 ppm of CO2 from a forest fire, the CO2 from the fire would have the same Δ14C value as the atmosphere (or very close to it). The Δ14C of the atmosphere would not change.
Patterns in the Story
So, we know that the ratio of carbon isotopes in atmospheric carbon dioxide samples is from a mixture of sources, and we also know the unique isotopic fingerprint of each of those sources. Using these two pieces of information, scientists can figure out why trends in Δ14C and δ13C occur. Globally, as atmospheric carbon dioxide levels continue to increase, both Δ14C and δ13C are decreasing over time. This is called the Suess Effect – named after Dr. Suess who first discovered this phenomenon.
Dr. Seuss seemed to truly understand the work of science–the need to collect data at all times of days and in every location. Only with years of work in all conditions can you have enough data to show a pattern as significant as the Suess effect. As Dr. Seuss said,
“if you want to catch beasts you don't see everyday, You have to be out-of-the-way, You have to go places no others can get to. You have to get cold, and you have to get wet, too.”
Wait a minute…that quote comes from If I Ran the Zoo, by Dr. Seuss…the Dr. Seuss that wrote The Cat in the Hat and How the Grinch Stole Christmas NOT the Dr. Hans Suess that discovered the Suess Effect. Either way, both seemed to understand a great deal about our environment and mankind's power to alter natural systems.
At a regional level, Δ14C and δ13C values can be quite variable. Changes on a daily or weekly basis in fossil fuel use in the surrounding region will greatly affect both of these measurements. Additionally, the nearby vegetation, and its uptake of carbon dioxide depending on the season, will alter the δ13C of the region.
| Measurement | Trend | Why? |
|---|---|---|
| CO2 Levels |  |
CO2 is currently being released from burning fossil fuels faster than it is taken up either on land or in the ocean. |
| Global Δ14C |  |
The percent of atmospheric CO2 that comes from fossil fuel emissions is increasing. |
| Local Δ14C | But Highly Variable |
Highly polluted areas have lower Δ14C values from fossil fuel burning. This value varies greatly depending on the quantity of fossil fuels emitted on a short time scale. |
| δ13C | |
Fossil fuels add CO2 to the atmosphere that have less 13C. This addition of CO2 is more than the amount of CO2 removed by the terrestrial biosphere. |
Explore up-to-date atmospheric measurements from NOAA's Carbon Cycle and Greenhouse Gases Group. You can see real data from around the world–from any site in the NOAA network!
 Previous
