|
Information
Results
Get Involved
Resources
|
|
Executive Summary (CT2007B)
|
|
Highlights
We present the second release of a combined measurement and modeling system that keeps track of the emissions ("sources") and removal ("sinks") of atmospheric CO2 globally from January 2001 to December 2006. CarbonTracker 2007B (released on 20 December 2007) incorporates four significant improvements over the previous release.
- We have incorporated new data for global CO2 emissions from fossil fuel burning and cement production. Emissions in China have increased especially rapidly, while emissions elsewhere increased less or were almost constant.
- New observations from three sites were added, Sable Island, Nova Scotia (Environment Canada), Storm Peak and Niwot Ridge, Colorado (National Center for Atmospheric Research).
- The submodel for atmosphere-ocean fluxes has been changed from being based on observations of the partial pressure of CO2 in ocean surface waters to being based on observed patterns of CO2 in deeper waters.
- New and up-to-date fire emissions estimates were added. These changes have decreased the residual differences between the modeled and observed atmospheric CO2 data. We also note that the effect of the drought in North America in 2002 is larger than our estimate in the first release.
|
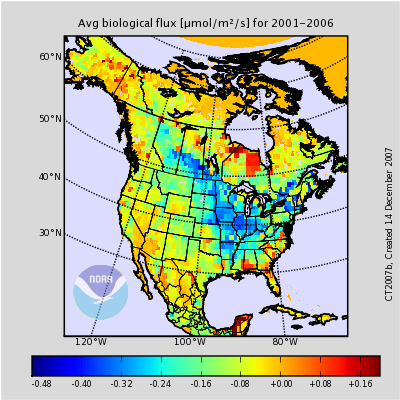
Figure 1: The long term mean biological uptake
|
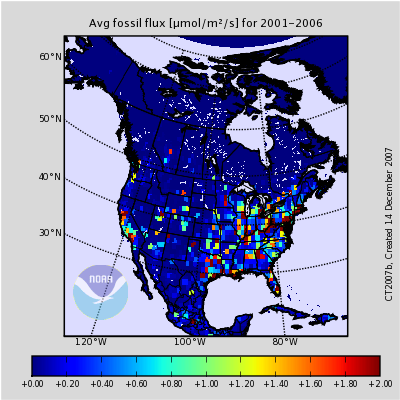
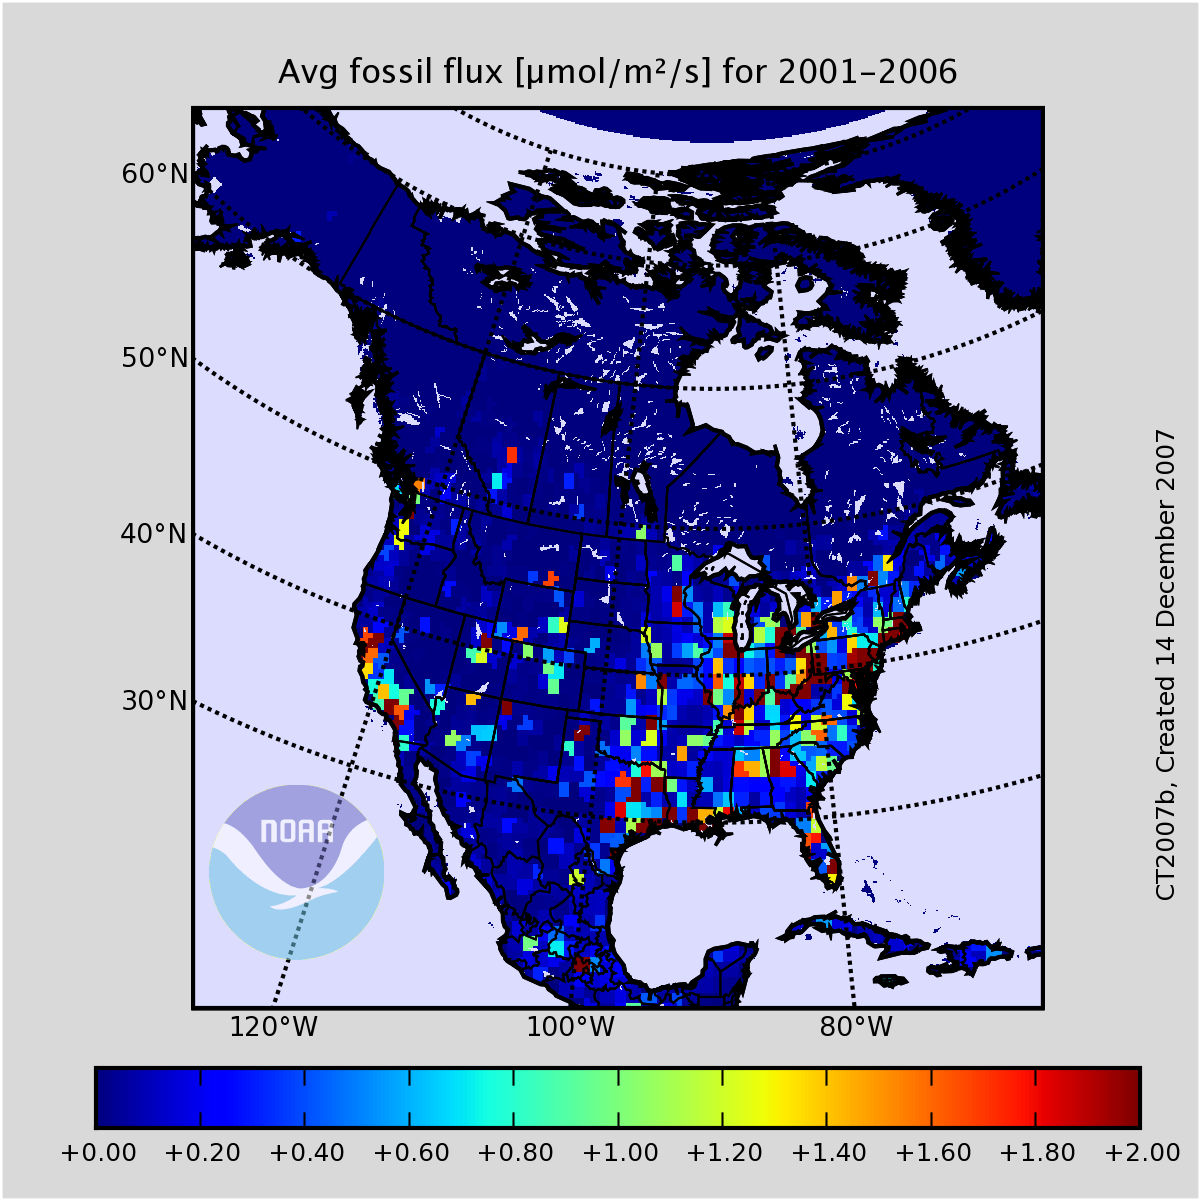
Figure 2: The long term mean fossil fuel emissons
|
|
Estimates of CO2 sources and sinks
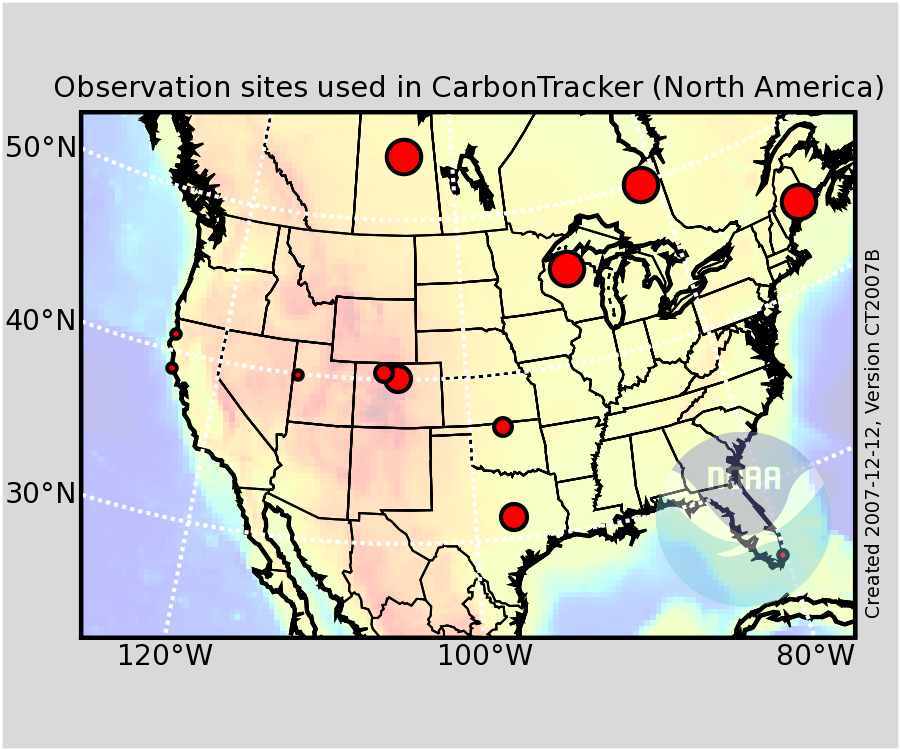
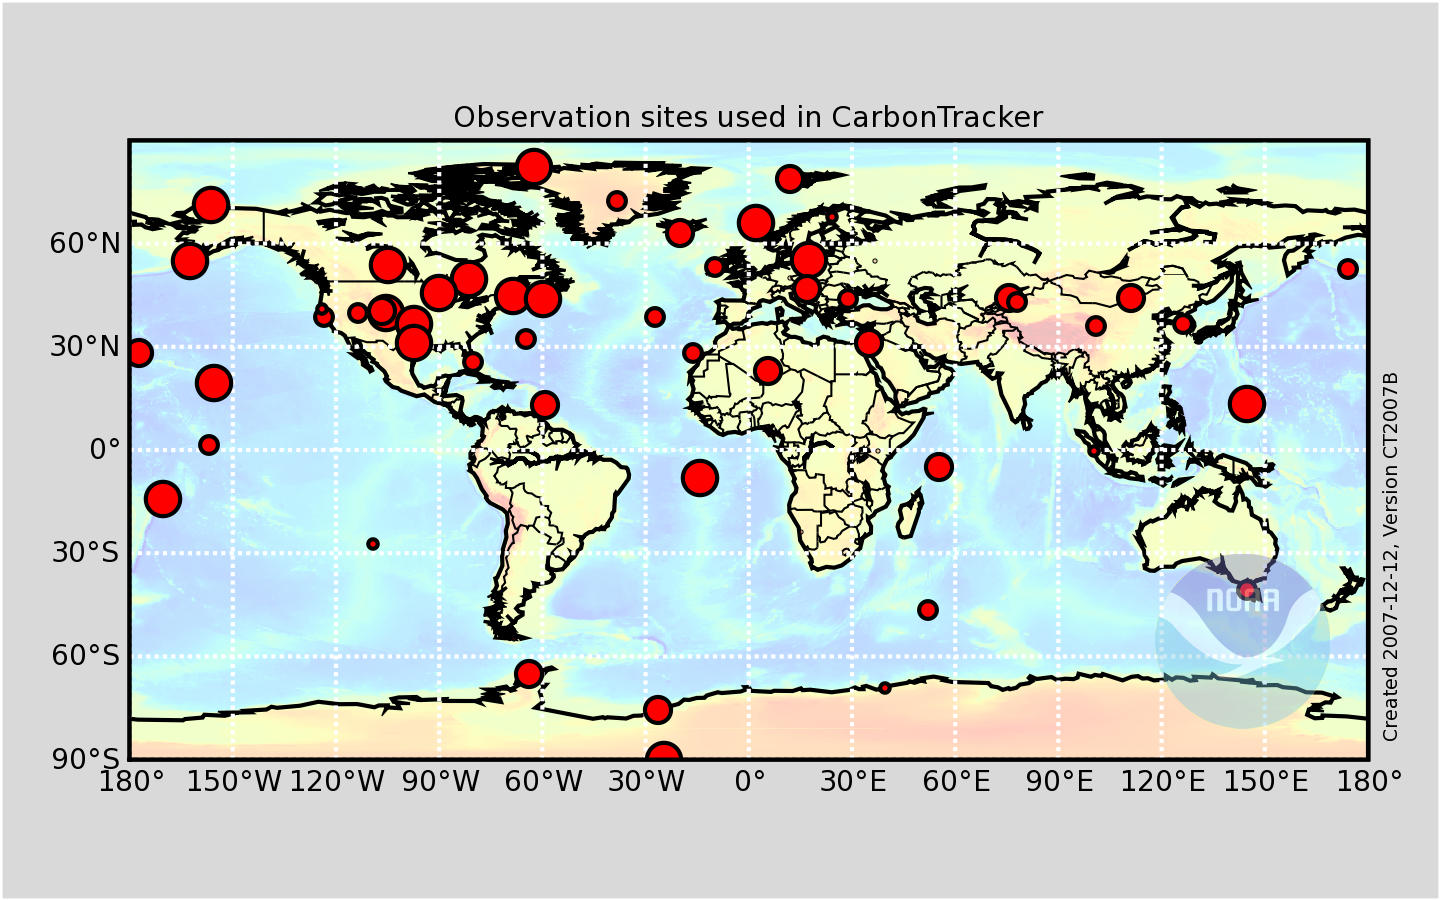
Ecosystems in North America have been a net sink of -0.67 ± 0.66 PgC/yr (1015 gC, or 1 billion metric ton C, or 3.7 billion metric ton CO2) during this period, partially offsetting emissions of 1.97 PgC/yr from the burning of fossil fuels in the U.S.A., Canada and Mexico combined. Our estimates include sub-continental patterns of sources/sinks coupled to the distribution of dominant ecosystem types across the continent (see Figures 1 and 2). The sinks are mainly located in the agricultural regions of the Midwest (36%), deciduous forests along the East Coast (33%), and boreal coniferous forests (17%). There also appears to be substantial interannual variation of the sink, correlated with temperature and moisture variations. The estimates are optimally consistent with measurements of ~17,000 weekly air samples from across the world, ~10,000 daily averages of continuously measured CO2 at sites surrounding the continent and ~10,000 daily averages from tall towers at four locations within the continent (see Figures 3 and 4).
|
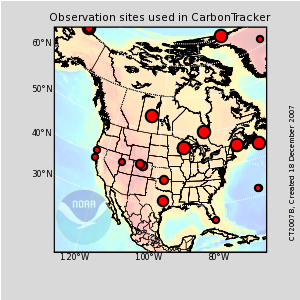
Figure 3: North American sites only
|
Calculated time-dependent CO2 fields throughout the atmosphere
A "byproduct" of the data assimilation system, once sources and sinks have been estimated, is that the mole fraction of CO2 is calculated everywhere in the model domain and over the entire 2001-2006 time period, based on the source/sink estimates. As a check on model transport properties, calculated CO2 mole fractions were compared with measurements of ~19,000 air samples taken by NOAA/ESRL at 30 aircraft sites, which had not been used in the estimation of sources/sinks. Column averages of the CO2 mole fraction have been calculated as well, and they can be compared to satellite measurements of the same quantity when the averaging is done in the same way as for the satellite results.
|
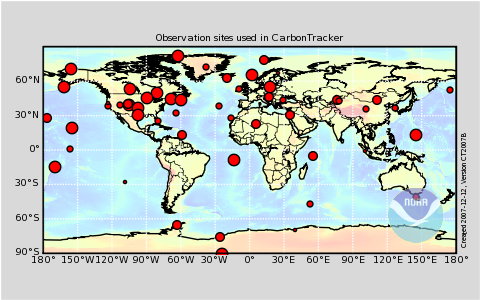
Figure 4: All observation sites used in CarbonTracker
|
Uncertainties
It is important to note that at this time the uncertainty estimates for the sources/sinks are themselves quite uncertain. They have been derived from the mathematics of the data assimilation system, which required several "educated guesses" for initial uncertainty estimates. The paper describing CarbonTracker (Peters et al. (2007), Proc. Nat. Acad. Sci. vol. 104, p. 18925-18930) presents different uncertainty estimates, based on the sensitivity of the results to 14 alternative yet plausible ways to construct the CarbonTracker system. For example, the 14 realizations produce a range of estimates for net annual mean terrestrial uptake in North America from -0.40 to -1.01 PgC/yr, as given in the PNAS paper. The procedure is described in the Supporting Information Appendix to that paper, which is freely downloadable from the PNAS web site. In addition, the estimates do not take into account several additional factors noted below. The calculation was set up for sources/sinks to slowly revert, in the absence of observational data, to "first guesses" of close to zero net annual mean for ecosystems. This procedure may have produced a bias. Also due to the sparseness of measurements, we had to assume coherence of ecosystem processes over large distances, giving existing observations perhaps an undue amount of weight. The process model for terrestrial photosynthesis and respiration was very "basic", and will likely be greatly improved in future releases of CarbonTracker. Easily the largest single annual mean source of CO2 is emissions from fossil fuel burning, which are currently not estimated by CarbonTracker. We use estimates from emissions inventories and subtract those from the total sources derived by CarbonTracker. A small relative error in the inventories would thus translate into a larger relative error in the annual mean ecosystem sources/sinks that have smaller magnitudes. We expect to add a process model of fossil fuel combustion in future releases of CarbonTracker. Finally, additional measurement sites are expected to lead to the greatest improvements, especially to more credible and specific source/sink results at smaller spatial scales.
|
|
CarbonTracker is a NOAA contribution to the North American Carbon Program
|
|