
|
 |
Understanding Past Weather to Improve Future PredictionsNew assimilation method using old weather data is feasible technique for improving forecast modelsBarb DeLuisi
Climate change on Earth and its possible causes have become major "hot topics" of scientific research over the past few decades. Recently, climate researchers have come to realize that in order to better understand changes in our global climate, we must improve our understanding the day-to-day weather variations. Many important things could be learned from analyzing our past climate over a period of at least 100 years. Unfortunately, there is not a lot of accurate global climate data beyond the past 60 years. So what's a researcher to do? One solution is to compile the scant observations that are available and combine them using physical relationships to produce a more extensive and improved dataset. By analyzing these data, it might be possible to figure out the patterns in the atmosphere that created past weather conditions. Although this idea initially had skeptics, researchers Gilbert Compo, Jeffrey Whitaker, and Prashant Sardeshmukh of ESRL and CIRES set out to prove that it might work. Why? With the availability of more accurate data, better computer simulations of past climate and weather can be made. This information could be used to study how and why our climate has changed. Or it could be used to examine "climate catastrophes," such as the Dust Bowl of the 1930s, figure out why they happened, and determine whether they are likely to happen more frequently as the climate changes. The idea of studying the past weather from the historical observations seems like a logical approach, so why hasn't it been done before? First of all, the needed technology didn't exist. Luckily, our modern weather prediction tools have advanced enough to make this a possibility. Second, we did not have the daily observational data in a digital format. The Quest for Data
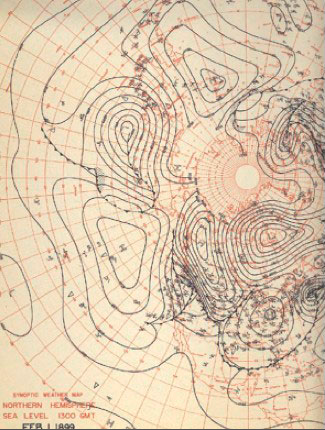
1899 weather map
Since the weather we experience occurs in the troposphere — the area of the atmosphere from the Earth's surface to about 11 km (6.8 miles) up in the air — Compo, Whitaker, and Sardeshmukh decided to focus on surface air pressure and sea level pressure observations over the past 100 years. By studying recent pressure data, as shown in their article in the February 2006 issue of the Bulletin of the American Meteorological Society, it is possible to get a snapshot of the other variables, such as the winds and temperatures, throughout the troposphere. "This was a bit unexpected," said Compo, "but it means that we can use the surface pressure measurement to get a very good picture of the weather back to the 19th century. Climate change may alter a region's weather and its dominant weather patterns. We need to know if we can understand and simulate the variations in weather and weather patterns over the past 100 years to have confidence in our projections of changes in the future." What Compo, Whitaker, and Sardeshmukh have shown is that the international community has digitized enough pressure data over the Northern and Southern Hemispheres that they can recreate the weather maps over the past 100 years. Filtering Out Errors
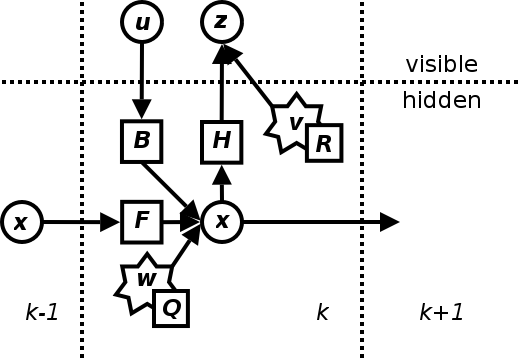
Kalman filter model
The researchers apply a numerical weather prediction model and a Kalman filter to the data to combine the imperfect pressure observations in a process called data assimilation. The filter step, named after Rudolph E. Kalman, provides a mathematical way to create the weather map for a particular time by blending all of the observations with a numerical weather model. This blending takes into account the meteorological situation and the error in the observations. In the case of creating the weather maps for a 100 years ago, very few observations are available and those observations are only at the Earth's surface, but the data assimilation procedure creates a complete map for the entire troposphere. "What we have shown is that the map for the entire troposphere is very good even though we have only used the surface pressure observations," says Compo. The filter can change continuously based on the location on the globe, the number of observations, or the meteorology. The filtering procedure currently takes one day to process one month worth of global data. The resulting weather maps are then given to the numerical weather prediction model to make a forecast of the past weather. The quality of these forecasts of the past will help us know if our weather maps are of a sufficient quality to be used for scientific study. An Interesting Data Subset — The Admiral Byrd Expedition

Students study historical maps
During their study of Byrd's adventures, the students discovered that some of the revamped data may help explain the atmospheric conditions that caused difficulties in some of Byrd's explorations. This additional data will also add to the completeness of the global data set. ConclusionsProving the skeptics wrong, the new and advanced data assimilation method studied by Compo, Whitaker, and Sardeshmukh has demonstrated that the idea of compiling old weather data and blending them is a feasible technique worthy of future investment. After creating the weather maps of the past 100 years, the researchers hope that better computer models can be developed based on this new historical data. The challenge will then be to understand why the weather of the past varied and whether we can predict how it may change in the 21st Century. |