4.6 Use and evaluation of the NCEP/NCAR reanalysis
4.6.1 Diurnal modes of variability in reanalysis datasets
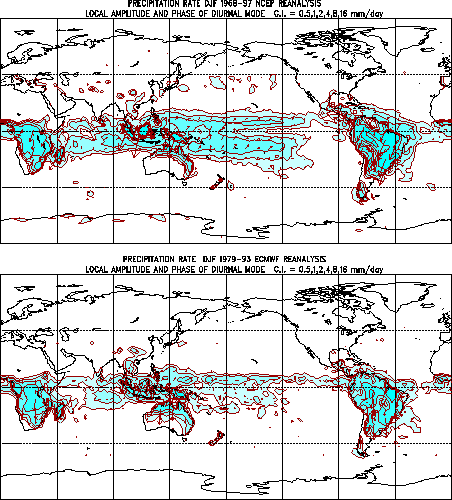
The diurnal variability of the diabatic forcing terms and thermodynamic variables in the NCEP and ECMWF reanalysis data sets was investigated. This study aimed to examine the realism of the reanalysis data on very short time scales. Diurnal variability is expected to reveal differences between the two reanalysis data sets because of differences in the physical parameterizations in the two reanalysis models. To narrow the scope of the investigation, we focused on the diurnal (24-hour period) mode of variability in both data sets. Figure 4.23shows the amplitude (contours) and phase (arrows, pointing to the maximum; upward = midnight, downward = noon local time) of the diurnal mode of precipitation rate for the NCEP (top) and ECMWF (bottom) reanalyses. The diurnal mode of precipitation was found to be significantly different in the two data sets, especially over the central and western Pacific Ocean. The NCEP precipitation has a higher amplitude over the Pacific Ocean. Further analysis of the diurnal cycle (including all harmonics) of precipitation showed that the NCEP precipitation in the western Pacific possesses an early morning maximum (visible in the top panel of Fig. 4.23), consistent with in situ observation from TOGA COARE. This characteristic is not well represented in the ECMWF reanalysis data. The diurnal components of all the terms in thecolumn-integrated thermodynamic equation was analyzed for the NCEP reanalysis. Over the ocean, the diurnal tendency of temperature is balanced mainly by the nearly-uniform net (short wave plus long wave) radiative forcing, latent heating (which possesses a similar pattern as precipitation), and adiabatic cooling/heating due to vertical motion. Thus, the diurnal tendency of temperature is substantially influenced by the physical parameterization pertinent to the generation of diurnal precipitation. An important implication of this project is that the error in the short-term variability of a model variable could be rectified into a bias in the long-term climatology. Since the diurnal precipitations in the NCEP and ECMWF reanalyses are significantly different, such a possibility deserves further investigation.

4.6.2 Tropical heating and the chi-problem
To understand the interactions between the tropics and the extratropics, it is important to determine accurately both the climatology and variability of atmospheric heating in the tropics. However, since there are no "heating meters" that may be employed for this purpose, heating is often estimated as a residual in the thermodynamic budget. This means that the vertical profile of horizontal wind divergence must be well specified. To gauge the accuracy of this critical field, we carried out an assessment of the mean structure and variability of deep convection over the tropical eastern Indian and western Pacific oceans as provided by three different reanalysis datasets for northern winter (DJF) 1980-93. The datasets were generated at the National Centers for Environmental Prediction (NCEP), NASA's Goddard Laboratory for Atmospheres, and the European Center for Medium-range Weather Forecasts (ECMWF). Rainfall, Outgoing Longwave Radiation (OLR), and 200 mb wind divergence fields from the three datasets were compared with one another and with satellite observations.
The internal consistency of the datasets is high, in the sense that the geographical extrema of the rainfall, OLR and divergence fields correspond closely to one another. On the other hand the external consistency, i.e. the agreement between the datasets, is so low as to defy a simple summary. Indeed, the differences are such as to raise fundamental questions concerning: (1) whether there is a single or a split ITCZ over the western Pacific ocean with a strong northern branch, (2) whether there is more convection to the west or the east of Sumatra over the equatorial Indian ocean, and (3) whether there is a relative minimum of convection near New Guinea. Geographical maps of interannual and intraseasonal variances also show similar Order 1 uncertainties, as do regressions against the principal component time series of the Madden-Julian Oscillation (MJO). The annual cycle of convection is also different in each reanalysis. Overall, the ECMWF reanalysis compares best with observations in this region, but it too has important errors.
Finally, we showed that although the 200 mb divergence fields in the three datasets are highly inconsistent with one another, the 200 mb vorticity fields are highly consistent. This reaffirmed the relevance of diagnosing divergence from knowledge of the vorticity using the method described in Sardeshmukh (1993). This would yield divergence fields from the three datasets that are not only more consistent with each other, but also more consistent with the 200 mb vorticity balance. This iterative procedure was applied to the NCEP/NCAR Reanalysis wind fields (1969-1999) to minimize the vorticity budget residual, and the divergent circulation was further constrained to satisfy the large-scale mass budget. Enforcing dynamical consistency on the divergent circulation had a noticeable effect on the strength, position, and variability of the diagnosed heating extrema. Sub-tropical cooling was also stronger in the chi-corrected dataset. In the tropics, the chi-corrected heating fields showed substantially greater variability, on time scales ranging from daily to seasonal, than the unmodified fields. Vertical profiles of chi-corrected diabatic heating and moistening for the northern winter of 1992-93 compared better with the profiles from observational COARE data than did the profiles from the original reanalyses. Monthly averages of this data have also been made available in atlas form on a CDC web page, http://psl.noaa.gov/chi/.
4.6.3 Tropical surface fluxes
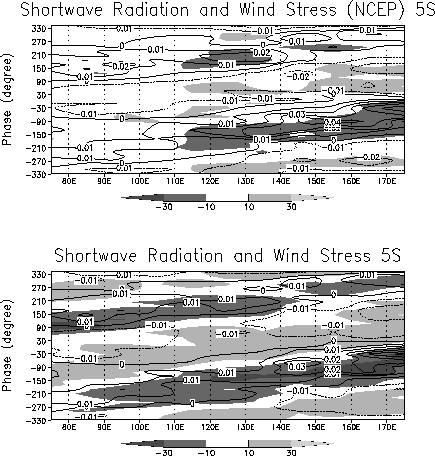
As a by-product of work on the MJO-induced surface fluxes, the reliability of the surface fluxes depicted by the NCEP/NCAR Reanalyses was assessed. On intraseasonal time-scales, fluxes that depend primarily on surface wind variations (e.g., stress and latent heat flux) agree more favorably with direct observations than fluxes that are largely dependent on fluctuations of convection (e.g., surface shortwave radiation and freshwater flux). This is demonstrated for a composite MJO (Fig 4.24). While the coherent eastward propagation of stress and latent heat flux are well depicted in the reanalyses, the composite short wave radiation exhibits less than half of the observed amplitude. The direct use of the reanalysis fluxes in studies of the heat budget of the warm pool is thus discouraged. Composite variations of wind stress and latent heat flux from the reanalyses agree better with observations such as during TOGA-COARE.
