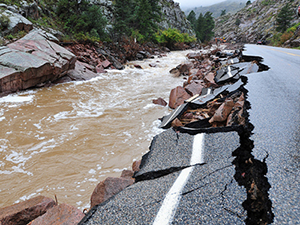
Damaged road from the 2013 Colorado flood (Credit: Tech. Sgt. Wolfam M. Stumpf, US Army, Air National Guard)
|
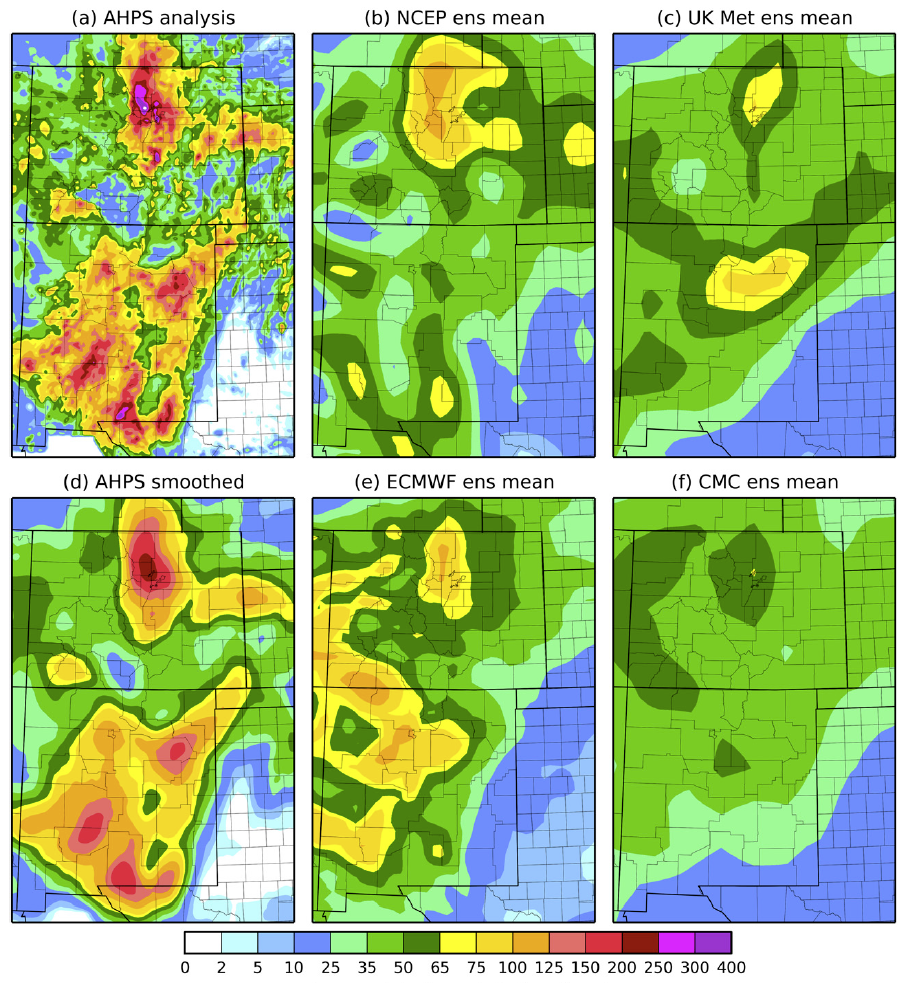
(a) Analyzed average precipitation (in mm) over Colorado and New Mexico between September 9-16, 2013; (d) is the 'smoothed' version. Compared to average precipitation from four global forecast models (b, c, e, f) for the same period.
|
A look back at the 2013 Colorado floods
How skillful were the precipitation forecasts from the weather forecast models?
September 19, 2014
The massive amount of rain that fell on the Colorado Front Range last September was devastating, with nine lives lost and property damage estimated at more than $2 billion. Forecasters expected heavy rain and were able to issue life-saving flash flood warnings, but the amount and duration of the heavy rainfall was unanticipated. As both a scientist and Boulder, Colorado resident, Tom Hamill, a meteorologist at ESRL’s Physical Sciences Laboratory who develops improved methods for making probabilistic weather forecasts, was especially interested in the flood event. He wanted to find out how well NOAA's weather forecast models predicted the event.
“This information can help forecasters understand how the forecast models may perform in possible similar future situations,” said Hamill, “and can also help identify key deficiencies that will be addressed with future model upgrades.”
In the aftermath of especially impactful weather events, NOAA’s National Weather Service (NWS) conducts service assessments. A team of experts from within and outside the NWS evaluate NWS activities before, during, and after the event to determine the usefulness of its products and services, and to help make improvements. Familiar with the assessments, Hamill noticed that they tend to focus primarily on performance of the forecast office itself and miss evaluating the quality of the model forecast guidance that’s provided by NOAA’s Environmental Modeling Center (EMC).
“I thought perhaps I could add something that hasn’t been in included in previous assessments,” said Hamill.
Feeling strongly that it was important to incorporate this type of information in the assessment, Hamill contacted NWS Director, Louis Uccellini, who agreed to include an examination of model performance. Hamill ended up participating in the overall assessment, including helping to interview forecasters and emergency managers, in addition to authoring a section on the performance of weather forecast models. His results were also recently published in the August 2014 issue of the Monthly Weather Review.
For his part of the assessment, Hamill began by looking at global precipitation forecasts from several different weather prediction systems, and then at shorter-range regional models produced by EMC. The global forecasts leading up to September 9-16, when the majority of the rainfall occurred, indicated unusually wet weather patterns, but underpredicted how much rain would actually fall.
“The models did show heavier amounts of rain coming,” said Hamill. But for the most part the timing, magnitude, and extent of heavy rainfall that struck the Front Range could not be accurately anticipated and predicted.
For example, Boulder County, one of the worst-hit areas, received an average of nearly 10 inches (250 mm) of rain during that period, but almost all the models predicted between 1½ to 3 inches (50-75 mm). The same was true of most of the shorter-range forecasts; the model predictions were not very close to actual amounts. There was one exception, however. NOAA’s Short Range Ensemble Forecast (SREF) system did correctly provide some simulations with exceptionally heavy precipitation over Boulder the days of heaviest rain. However, the SREF system also forecasted heavy precipitation to occur the day before the actual onset, so forecasters may have dismissed the correct heavy precipitation forecast the next day.
Of course, most of the direct impact was not from the rain itself but from the stream and river flooding in its aftermath. Among the huge spectrum of damage to buildings, roads, and dams: 30 state highway bridges and 1,500 homes were destroyed. The NWS Weather Forecast Offices (WFOs) provide short-term, local flash flood forecasts. NOAA’s regionally-based NWS River Forecast Centers (RFCs) are responsible for main stem river forecasting for floods (covering the bigger river basins, such as the South Platte). The RFCs have many hydrologic tools available and forecasts generally cover a longer time period. The crucial piece for both the RFC and WFO warnings is accurate precipitation forecasts.
The Colorado floods are a stark reminder of the need for timely and more accurate precipitation information, so people have time to prepare and be even safer in the future. As the results of Hamill’s study showed, current precipitation forecast models can gave us a head’s up for the potential of heavy rain, but there is still is much room for improvement. Accordingly, one of the major recommendations from the service assessment was that NOAA “should execute a sustained, collaborative research and development program that engages academic and federal partners to improve QPF and substantially increase the skill in detecting extreme precipitation events.” Hamill hopes to be part of the team that brings this to fruition.
Contacts
- Tom Hamill, Meteorologist, NOAA/ESRL Physical Sciences Laboratory
- Barb DeLuisi, Communication Specialist, NOAA/ESRL Physical Sciences Laboratory