Interpretation of Plots Relating El Niño to Temperature and Precipitation
Risk Plots:
Purpose:
These plots show the relative odds that a particular type of event had an extreme wet/dry or warm/cold season.
Interpreting the numbers
| Increased Risk Plot: The to the right map shows "dark blue" for El Nino/Temperature/Increased Risk/JFM for a Southeastern Colorado . What does that mean? Looking under the "sky blue" on the color bar, we see +50 percent. This means El Nino has increased the risk of a cold season by 50% over random chance. For the numbers used (see details page link), ~5 years* or 20% of 24 would be expected to be in the coldest 20% by chance. A 50% increase is can be written as 100%-((actual cold years/5)*100%)=50% or the actual number of cold years is 7. So, we say from this map that there was a 50% increase in the expected number of very cold seasons. *5: years are rounded from 4.8 as there can only be an integer number of years | 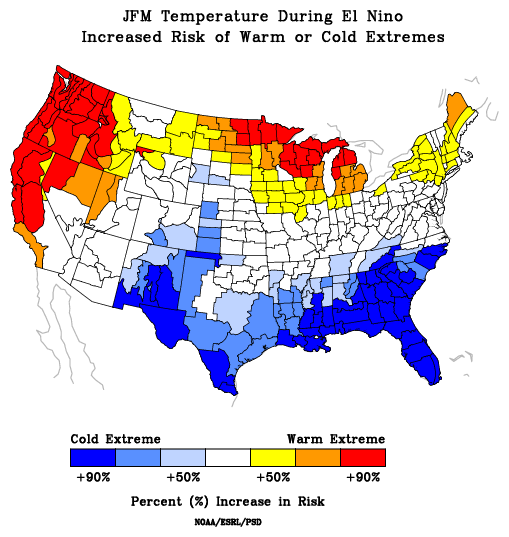 |
| Decreased Risk Plot: Similarly for suppressed years using any Alabama division, the dark blue is a "100%" decrease in expected risk of a warm season. Since again 5 are expected by chance, we can calculate that 100%-((actual warm years/5)*100=50% means that there were 0 actual warm years. | 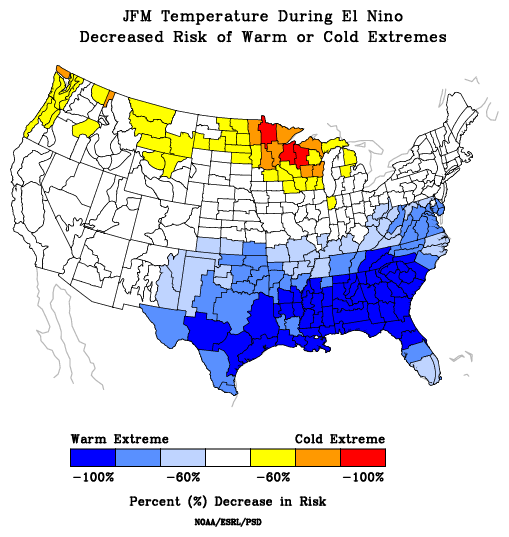 |
Contrasting with "Composite Plots"
Composites ENSO plots show the average of a variable for an event. It is possible all years in the composite have a similar response to ENSO. It is also possible a few extremely strong events dominate. it is even possible the risk will be of a different sign than a composite.
Caveats:
Risk analysis may have different results if there are changes in the cutoffs or definitions of ENSO. In addition, some extremes may only be associated with very strong events. To the extent we have a limited record, it may not be possible to say something significant about those events from the historical record and other methods (like models) may be needed. There is no guarantee that results using past data will match those in the future. And, there is also some noisiness in the Earth's climate system.