Measurements at the Mauna Loa Observatory stopped after the 2022 eruption of the Mauna Loa volcano, when lava flow crossed the access road and took out power lines to the facility. The observatory remains inaccessible by vehicle and without power from the local utility company.
Observatory staff has established limited solar power in four observatory buildings and restored approximately 33 percent of the measurements onsite, including the Global Monitoring Laboratory and Scripps critical CO2 records and other atmospheric measurements.
Media can contact: Theo Stein (303) 819-7409 (theo.stein@noaa.gov) or Karin Vergoth 303-632-6413 (karin.vergoth@noaa.gov)
In 2000, an innovation on the standard lidar technique was developed at Mauna Loa Observatory to measure boundary layer aerosols. A proposal in collaboration with Central Connecticut State University (CCSU) was funded by the National Science Foundation (NSF) to develop an instrument to be used by the NOAA ESRL aerosol group for both long-term monitoring and campaign monitoring of boundary layer aerosols.
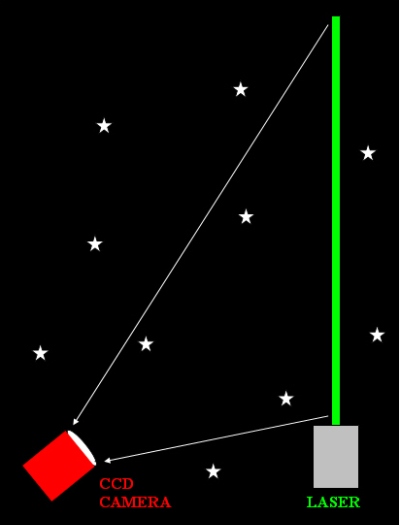
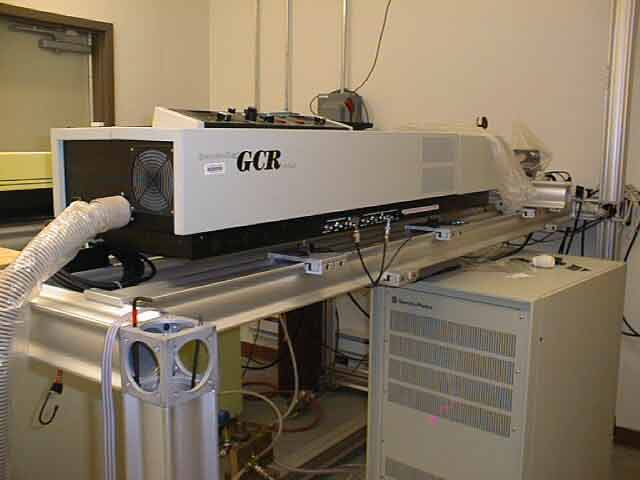
The Clidar technique uses a charge-coupled device (CCD) camera (shown here) to image an entire laser beam from a few hundred meters away. The method has very high altitude resolution in the boundary layer, can measure accurately all the way to the ground, and is a relatively simple instrument. Data can be compared to measurements from the Mauna Loa in situ nephelometer (see ESRL Aerosol program).
The program focuses on obtaining high resolution aerosol measurements in the lowest few kilometers of the atmosphere. It quantifies aerosols in meters per steradian.
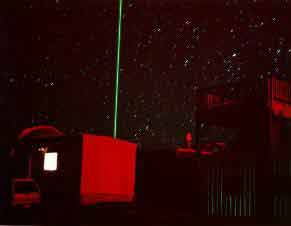
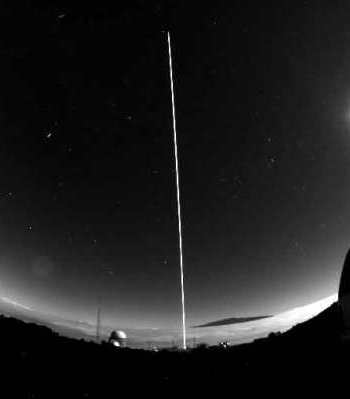
The image below was a 332 second exposure taken September 20, 2005 with an Apogee Alta camera. Although it was dark, the long exposure allow the summit of Mauna Kea to be visible in the background. The entire beam was captured with the wide angle optics of the ccd.
Understanding aerosol characteristics in the atmosphere is important for a wide variety of local, regional, and global atmospheric studies. Knowledge of the spatial and temporal distribution of atmospheric aerosols provides information for local air pollution compliance studies, investigations of the health effects of natural and anthropogenic aerosols and precipitation pattern research.
Aerosols play a strong role in the Earth's radiation budget and affect cloud properties. Thus, aerosol measurments are important in global climate change. As aerosol types, chemistry, concentrations and effects on radiation budgets are highly variable and strongly altitude-dependent, measurements of aerosol properties as a function of altitude are especially important for understanding physical, chemical, radiative and dynamical properties of the atmosphere.
The Clidar instrument is designed to optimize low altitude measurements because the majority of aerosols reside in the lowest few kilometers of the atmosphere within the atmospheric (or planetary) boundary layer.
Aerosols in the boundary layer can be natural or man made. They produce a cooling effect and can change cloud properties, which in turn affects the heating and cooling of the atmosphere. Understanding aerosols contributes to our knowledge of the radiative balance of our planet and thus enhances our understanding of factors affecting climate change.
A cooled digital (CCD) camera with wide angle optics images a vertically-pointing Nd:YAG laser beam from the side. The camera is located 100 meters or more from the laser. The intensity of the beam in the image provides information on the amount of aerosol and molecular light scattering at the corresponding altitude. The altitudes of the beam and the pixels in the image are determined by geometry. Successive images are analyzed to determine the intensity of the light scattered by aerosols over the course of time. Scattering from air molecules is subtracted using a normalized molecular model to determine aerosol scattering.
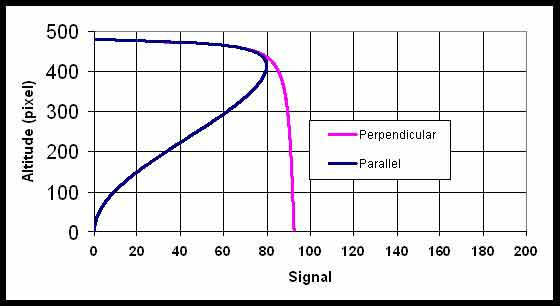
The plot below illustrates one advantage of the CLidar system: the dynamic range of the signal is several orders smaller than that of a typical lidar system.

With a polarized laser, the signal reaching the CCD will depend on where you set up your camera. The graph below illustrates two extremes: a camera configured perpendicular and parallel to the line of polarization of the laser.
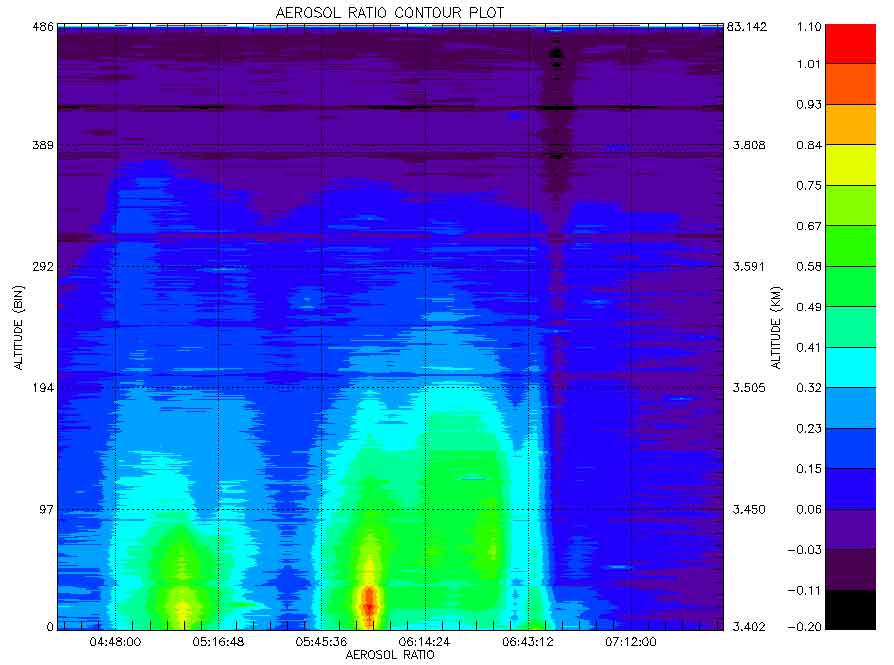
The aerosol ratio contour plot below was generated from Clidar data taken at Mauna Loa Observatory, Hawaii (3.4 km above sea level) on December 21, 2005, using an ST-237 CCD Camera.
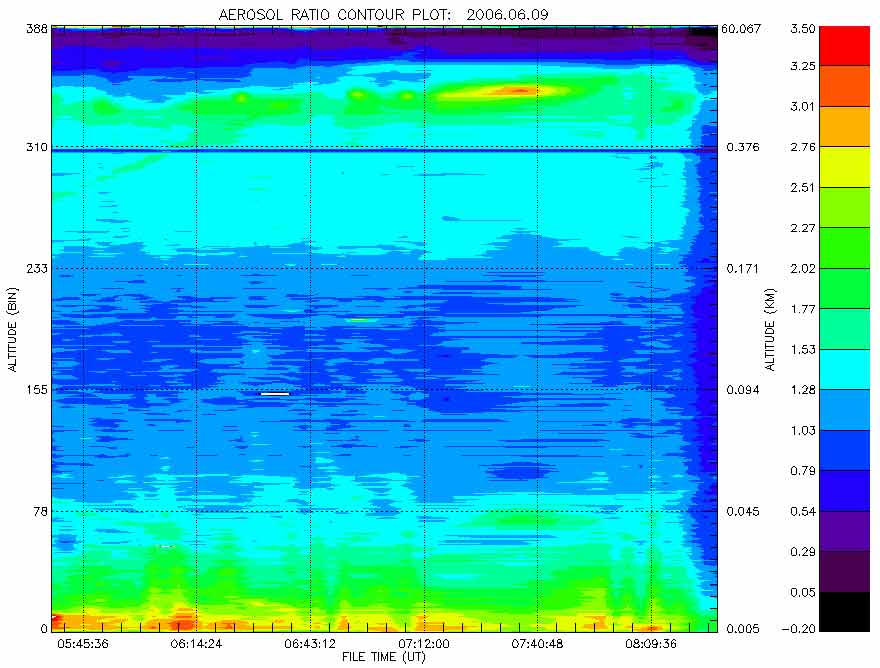
The aerosol ratio contour plot below was generated from Clidar data taken at Cape Kumukahi, Hawaii (sea level) on June 09, 2006, using an Apogee Alta CCD Camera.
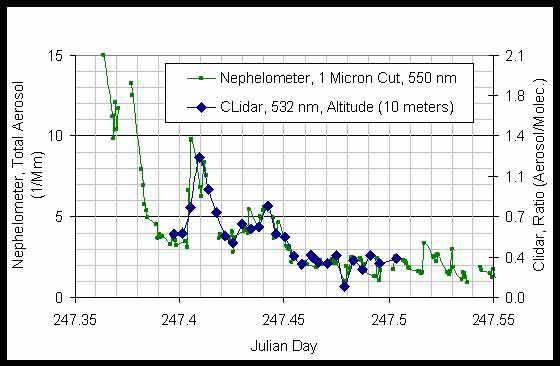
An in-situ Nephelometer is used to compare the Clidar data, shown below.
This material is based upon work supported by the National Science Foundation under grant number 0320800. Any opinions, findings, and conclusions or recommendations expressed in this material are the opinions of the author(s) and do not necessarily reflect the views of the National Science Foundation.
Dr. John E.
Barnes
808-933-6965 (x222)
Nimmi Sharma(CCSU)
860-832-2937
Trevor Kaplan
808-933-6965 (x226)
2000
Mauna Loa (HI) Lidar
Boulder (CO) Lidar
Samoa Lidar
Trinidad Head (CA) Lidar
General Lidar Info
Station Alt: 3397 m Latitude: 19.539 N Longitude: 155.578 W Time Zone: GMT -10 Laser Type: Nd:YAG Frequency: n/a Acq Board: CCD Camera # Channels: n/a (nm) used: 532