Measurements at the Mauna Loa Observatory stopped after the 2022 eruption of the Mauna Loa volcano, when lava flow crossed the access road and took out power lines to the facility. The observatory remains inaccessible by vehicle and without power from the local utility company.
Observatory staff has established limited solar power in four observatory buildings and restored approximately 33 percent of the measurements onsite, including the Global Monitoring Laboratory and Scripps critical CO2 records and other atmospheric measurements.
Media can contact: Theo Stein (303) 819-7409 (theo.stein@noaa.gov) or Karin Vergoth 303-632-6413 (karin.vergoth@noaa.gov)
Atmospheric O2 concentration, reported as the O2/N2 ratio.
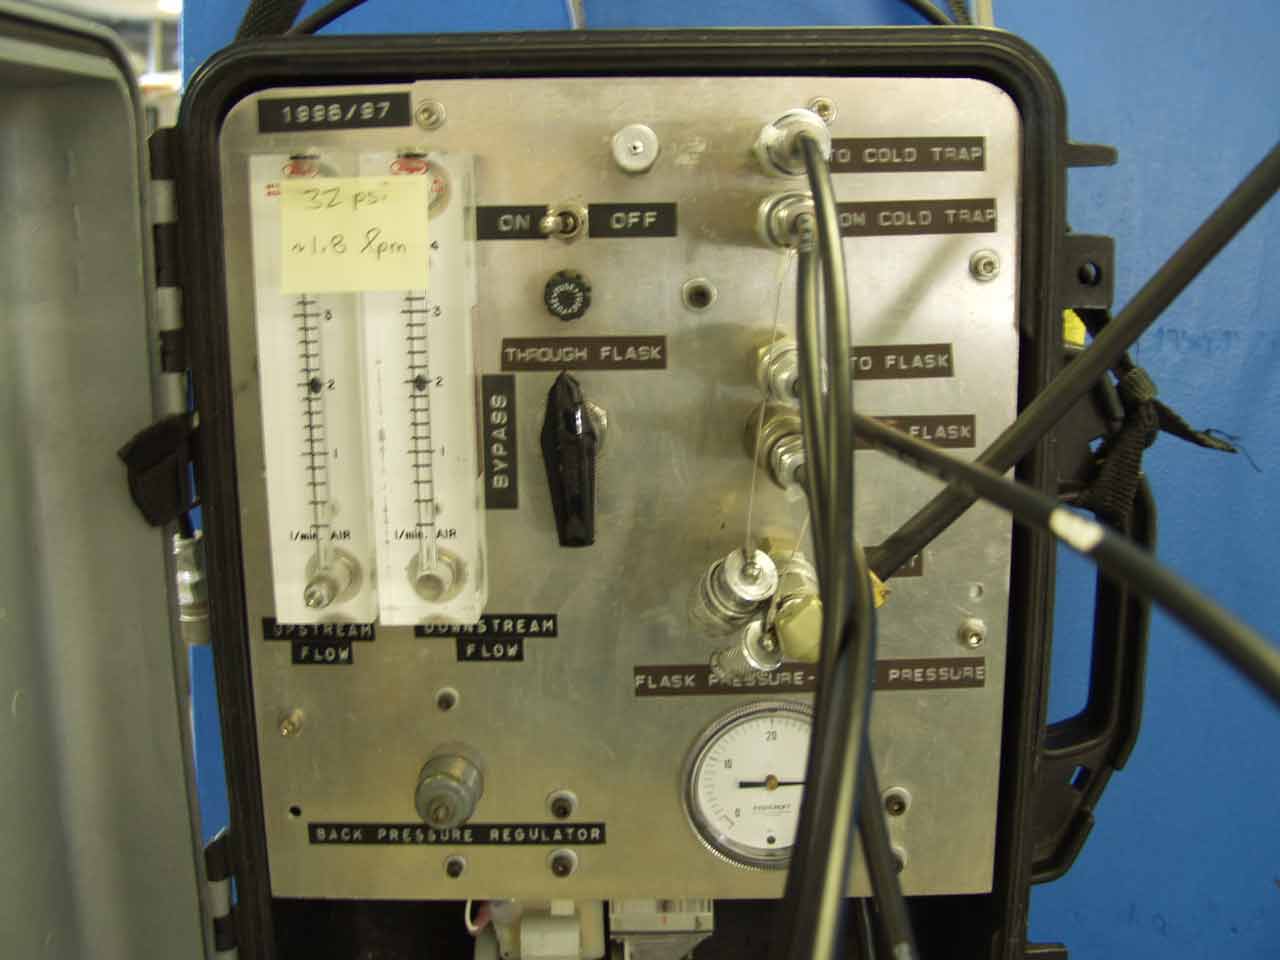
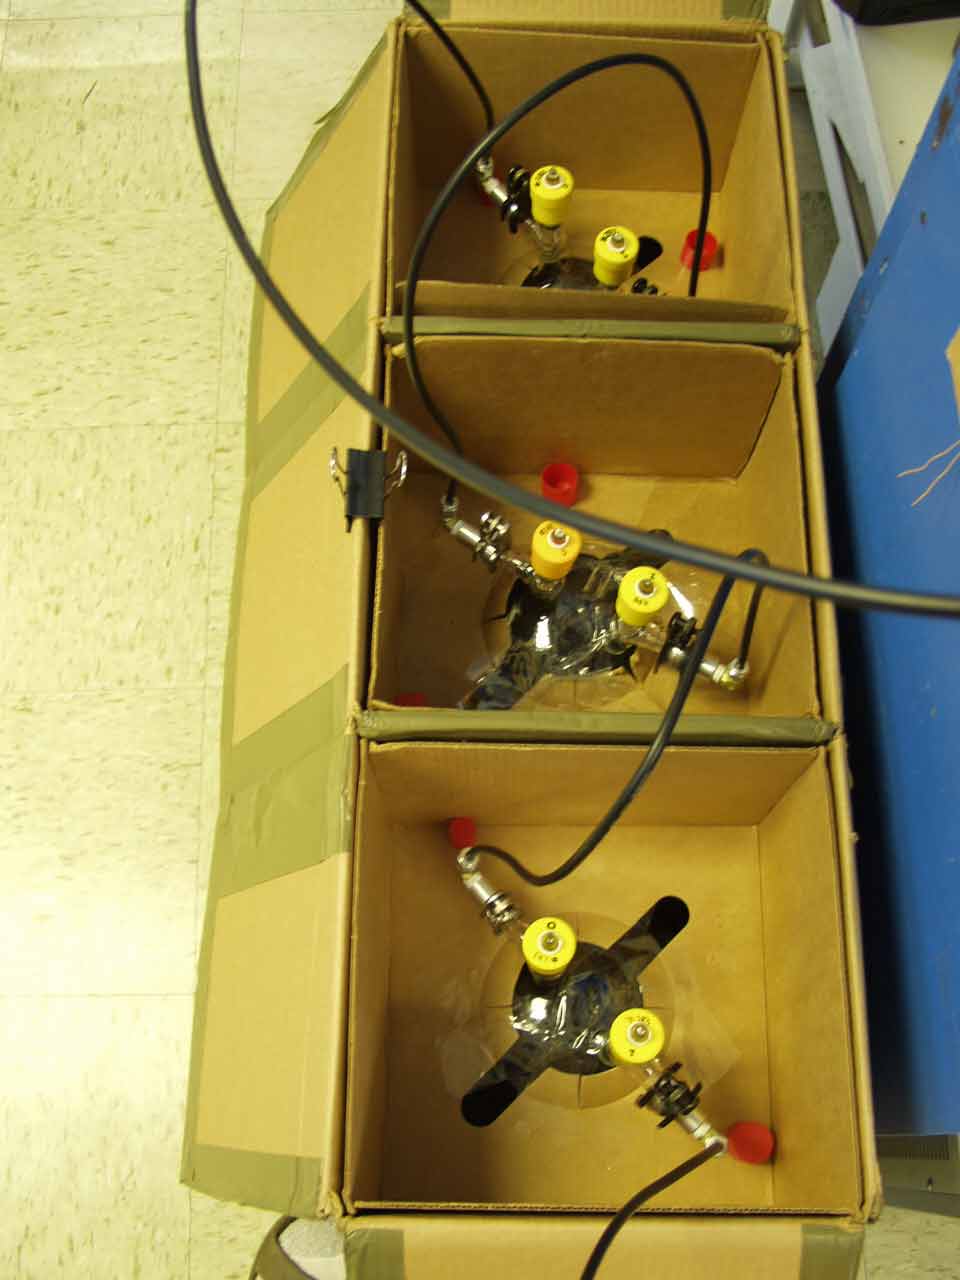
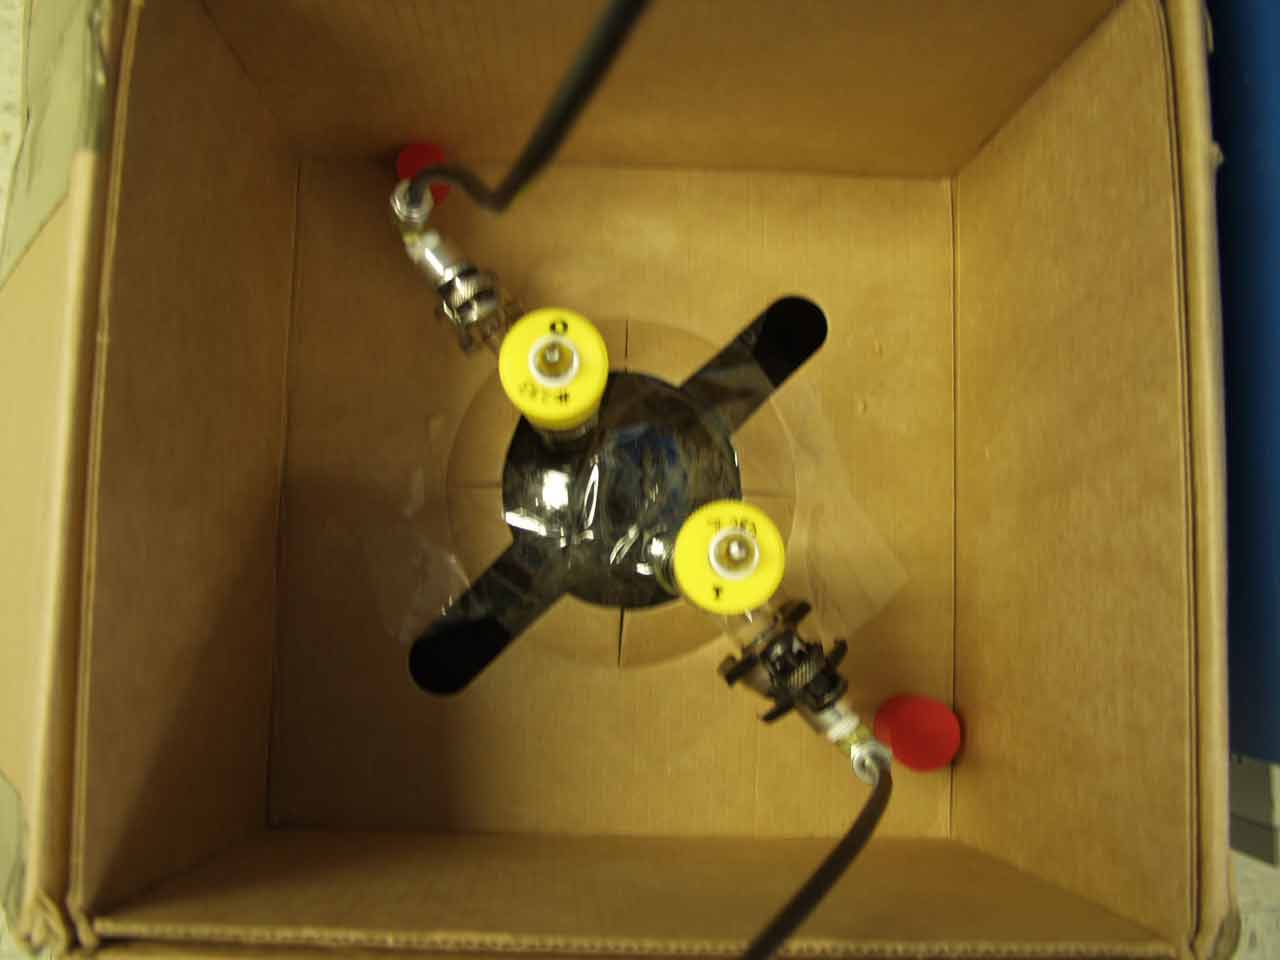
A sampling pump draws air through tower intake lines (made of 3/8” dekeron) into 5-liter flasks for bi-weekly overnight sampling periods at Mauna Loa and for bi-weekly 50 minute sampling at Cape Kumukahi, Hawaii.
It is important to investigate changes in the O2/N2 ratio of air which provides a constraint on the global carbon cycle, and is coupled to the oxygen cycle by photosynthesis, respiration, and combustion.
From 1991 through 2005, the O2 content of the atmosphere has dropped by 0.00248% (248 per meg) of it's initial amount. The rate is mostly explained by the global combustion of fossil-fuel over this period, although the actual rate is slightly smaller than expected from fossil-fuel alone. The difference evidently reflects a global imballance between photosynthesis and respiration.
The O2/N2 data from flasks collected at Mauna Loa are shown in the plot below. Each point is the average of flasks collected on a given day. A smooth trend consisting of a regular seasonal cycle and a long-term trend is fit to the data. The O2/N2 ratio is expressed in per meg units, which express the relative change in the O2/N2 from a standard ratio, multiplied by 1 million.
The program provides data that can be used to determine the global sinks of CO2 in the land and oceans, and provide measures of global metabolic activity.
More information is available at the Scripps Atmospheric Oxygen Monitoring Group website: http://bluemoon.ucsd.edu/
Dr. Ralph Keeling
858-534-7582
Steve Ryan
808-933-6965 (x235)
Paul Fukumura
808-933-6965 (x223)
July, 1993
Scripps Carbon Dioxide
Greenhouse Gases