| Differences | ||||||||
|---|---|---|---|---|---|---|---|---|
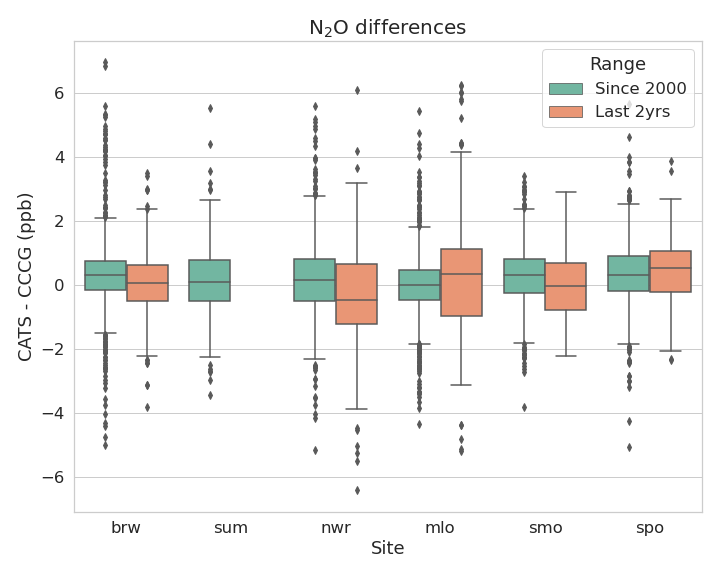
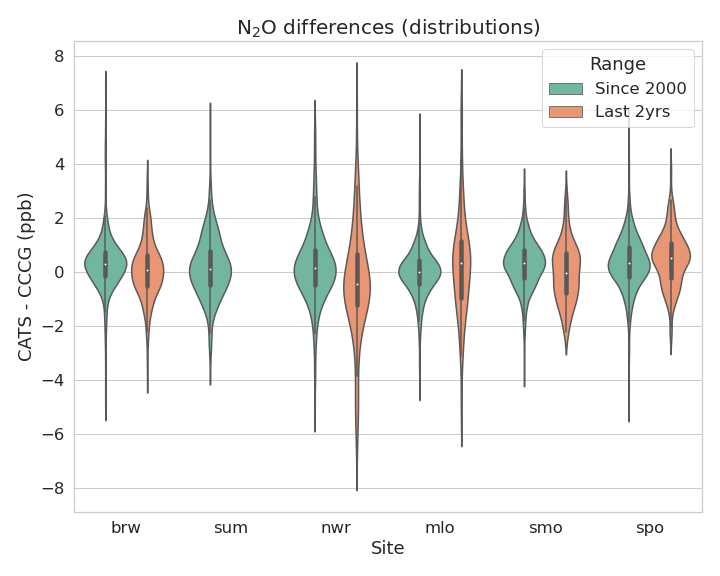
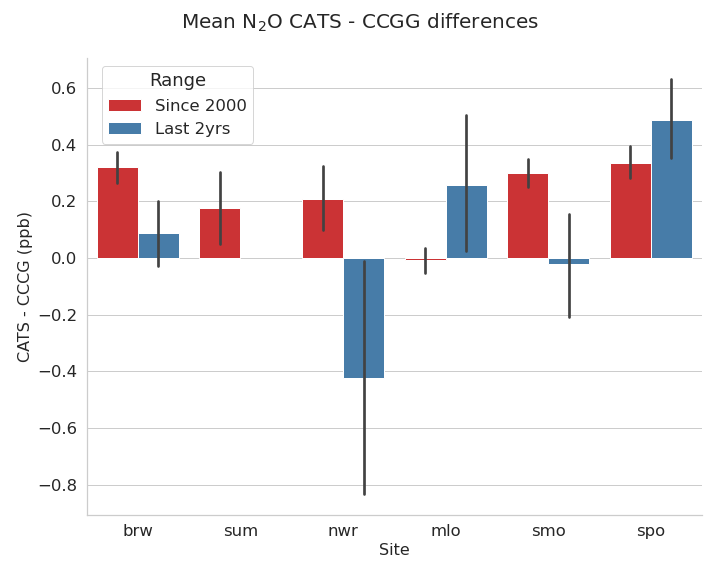
| Site | count | mean | std | min | 25% | 50% | 75% | max |
| brw | 1848 | 0.288 | 1.067 | -5.002 | -0.253 | 0.276 | 0.750 | 6.953 |
| mlo | 1922 | 0.032 | 1.113 | -5.198 | -0.490 | 0.023 | 0.521 | 6.243 |
| nwr | 622 | 0.116 | 1.489 | -6.406 | -0.599 | 0.054 | 0.783 | 6.079 |
| smo | 1298 | 0.285 | 0.895 | -3.806 | -0.259 | 0.318 | 0.814 | 3.401 |
| spo | 1416 | 0.353 | 0.978 | -5.066 | -0.210 | 0.361 | 0.939 | 5.649 |
| sum | 315 | 0.179 | 1.154 | -3.441 | -0.495 | 0.107 | 0.780 | 5.534 |