
LACE Results from September 1996
Download a postscript version of this plot: lacesept96.ps
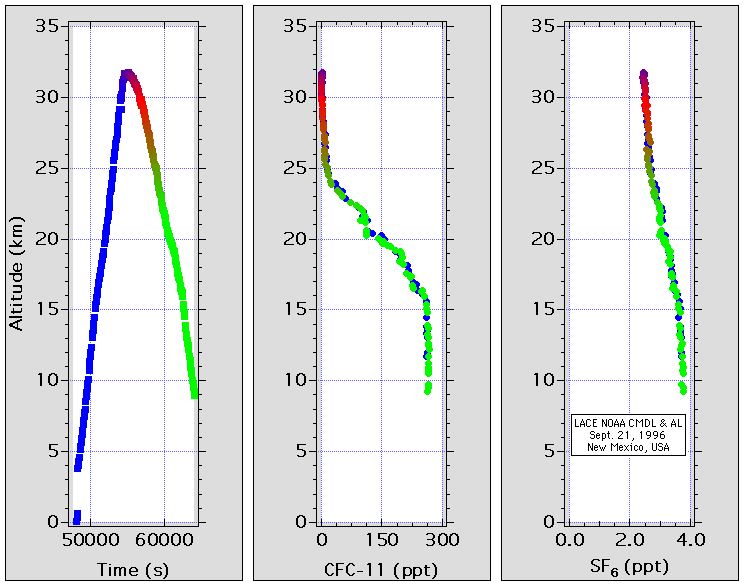
This figure shows our preliminary results for a balloon flight on September 11, 1996 from Ft. Sumner, New Mexico, USA. The ascent data are in blue, float data in red, and descent data are in green. The left panel shows altitude in km versus time in GMT seconds. The center panel shows altitude versus mixing ratios of CFC-11 in ppt. The right panel shows altitude in km versus mixing ratios of sulfur hexafluoride (SF6) in ppt. Note that CFC-11 decreases to values of ~1 ppt as altitude increases, whereas SF6 does not go to near zero. The reason is that CFC-11 is photochemically destroyed in the stratosphere, and SF6 is not and is a good indicator of age of the air mass. SF6 has a long lifetime and is increasing at a high rate each year (6.7% yr-1). For more information on this work, please contact: Dr. Fred L. Moore.
Download data used in this plot: GC960921.BA1
![]() Back
to the LACE home page
Back
to the LACE home page