
With the release of the WMO CO X2014A scale revision (December 2015), we changed the method of maintaining the WMO CO in air scale. Previous scales were defined by repeated sets of gravimetric standards made every 4-6 years. With X2014A, we maintain a single set of primary standards (14 gravimetric standards made in 2011) and all calibrations since July 2011 are traceable to this single set. This is more consistent with how other calibration scales are maintained by NOAA. However, the lack of stability of CO standards in high pressure aluminum cylinders means we had to develop a method to track drift in the primary standards. We use an internal tracer technique to monitor and correct for the slow growth of CO in the primary standards. See https://gml.noaa.gov/ccl/co_scale.html for a detailed description of the internal tracer technique and the primary standards. Briefly, percent-level gravimetric mixtures of CO and CH4 in air are used as “parent” tanks. We assume growth of CO has no significant impact on the gravimetrically determined CO:CH4 ratio in these parent tanks. Static dilutions from the parent tanks are made to create suites of daughter standards (termed dilution standards) with CO covering the range of interest (30 – 1000 nmol mol-1). CH4 in the dilution standards is measured within a few days of preparation, and CO is calculated using the known CO:CH4 ratio of the parent. The parents are assumed stable, and by making fresh sets of dilution standards and using them to calibrate the primary standards within days of production we can determine the growth rate of CO in the primary standards.
At GGMT-2015 we described the internal tracer method, and the X2014A scale revision was released shortly thereafter. The drift corrections applied to the primary standards for the X2014A scale revision were based on the initial gravimetric value for each primary standard plus the average of the first 5 measurement episodes (spanning approximately one year) using the internal tracer technique. Drift rates assigned to the primary standards ranged from 0 to 1 ppb/year. We have continued measuring the primary standards twice per year using the internal tracer technique and an updated assessment was presented at GGMT-2017. The latest calibration episode occurred in May 2018.
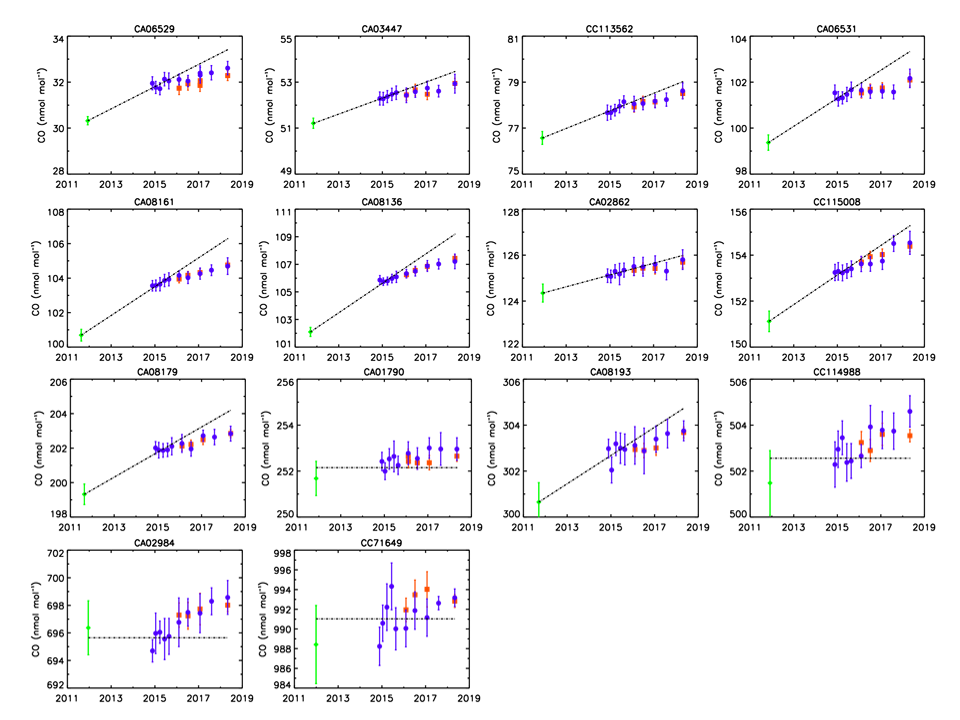
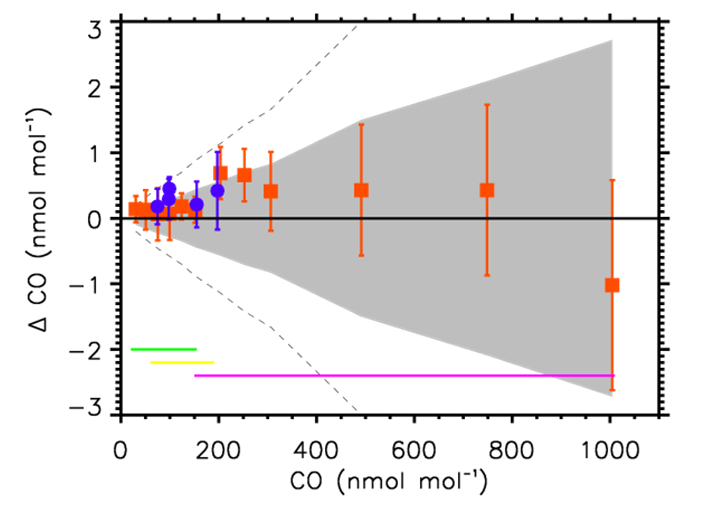
Since the X2014A scale revision, subsequent measurements have shown that drift rates applied to the primary standards were too large. This introduces a time dependent bias in the scale as indicated by the difference between the dashed lines (the drift corrected values based on the X2014A assignments) and the recent measurements of the primary standards in figure 1. In addition, recent measurements using the internal tracer technique indicate there is either an initial non-linear drift in many of the primary standards or the initial gravimetric values were wrong. Evaluation of the internal tracer technique against newly-made gravimetric standards in 2015 and 2017 (figure 2) shows the two techniques agree very well prior to the onset of significant CO growth in the gravimetric standard cylinders. The measured values for the gravimetric standards determined from the internal tracer technique in both validation studies are within the 68% CI gravimetric uncertainty envelope for all but two and well within the 95% CI envelope for all of the gravimetric standards. We do not think the initial discrepancy between gravimetrically determined value and a linear extrapolation of the measurement results to time zero is caused by a method bias between the gravimetric technique and the internal tracer technique. It is most likely due to initial nonlinear growth of CO in the cylinders. This behavior has been observed in a few other cylinders but is not understood and is not typical. However, we are still investigating and hope to resolve this issue before an update of the scale in late 2019.
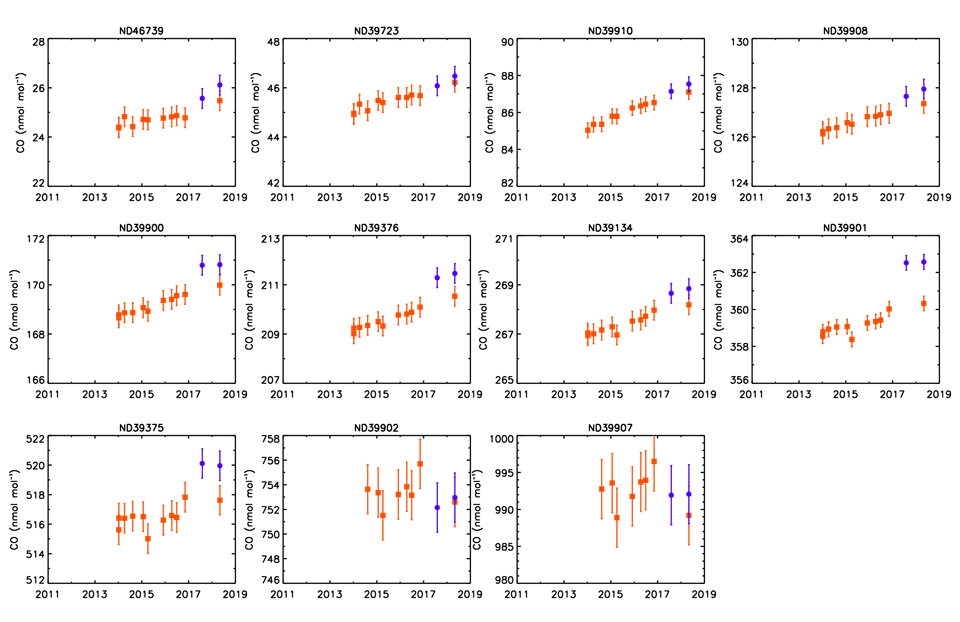
We have also become aware of a bias between the two analytical techniques (vacuum ultraviolet resonance fluorescence spectroscopy (VURF) and off-axis integrated cavity output spectroscopy (OA-ICOS)) used to calibrate cylinders since 2004. This analytical bias shows up most clearly when secondary standards are calibrated vs the primary standards on a provisional scale that corrects the drift rates of the primary standards (figure 3). This provisional scale assumes linear drift and does not use the initial gravimetric value in the drift assessment. It does not correctly account for the potential non-linear drift in the primary standards prior to measurement vs. the internal tracer technique. The observed bias is mole fraction dependent with a maximum of +2 ppb (VURF – OA-ICOS) at 360 ppb CO. At higher mole fractions, analytical noise may obscure the bias. The analytical bias does not show up when the primary standards (or any of the validation gravimetric standards) are calibrated vs the dilution standards using the internal tracer technique (see figure 1). We suspect that it is caused by a difference in the composition of the secondary standards relative to the primary standards effecting one of the two analytical techniques (a matrix effect), but this is still under investigation.
It is important to note that the secondary standards are used in the calibration hierarchy to extend the lifetime of the primary standards. All calibrations by the CCL are done against the secondary standards. The assigned values of the secondary standards on the X2014A scale are based on measurements of the secondary standards against the primary standards from 2011 - 2015 using OA-ICOS only.
At the tertiary level on the X2014A scale, the agreement between the two analytical techniques is complicated by the inclusion of the scale bias (discussed above) in the non-linear curve fits of the calibration curves generated by the secondary standards along with any matrix effects due to the composition of the secondary standards. The difference between the calibration results on the two analyzers is of opposite sign with the VURF results typically being ~0.5 to 1.5 ppb lower than the OA-ICOS results over the range 50 - 500 ppb CO.
We hope to resolve the issue prior to the next scale revision. Beginning in May 2018, all cylinders have been measured using both analytical techniques in parallel, and this will continue until we can determine the cause of the offset. Results from both techniques are available on the CCL website (gml.noaa.gov/ccl/refgas.html ), although we will issue certificates based only on the VURF technique to be consistent with the previous year when only the VURF analyzer was in use. We caution users to be aware of the analytical bias when cylinders are re-calibrated to check for drift.