
The WMO CO2 in air scale has been updated to WMO CO2 X2019. This scale revision has been retroactively applied to all calibrations performed at NOAA. Full details of the WMO CO2 X2019 scale is given in Hall et al., 2020
The WMO CO2 X2019 scale is based on 19 primary standards covering the nominal mole fraction range 250 - 800 ppm. All primary standards are natural air in high pressure aluminum cylinders. The CO2 content was modified by spiking with a 10% CO2 in natural air gas to target higher than ambient values or by trapping CO2 during a portion of the filling process to target lower than ambient values. Value assignment of the primary standards comes from repeated (approximately every 2-3 years) manometric determinations (https://gml.noaa.gov/ccl/manometer.html). The latest manometric episode included in X2019 occurred in 2015-2017. Table 1 lists the primary standards along with their average manometrically determined values. 15 of the 19 primary standards were used to define the previous WMO scale (WMO CO2 X2007) and their values have been updated based on additional manometric episodes and improved knowledge of the NOAA manometer. Four additional primary standards were added to expand the upper range of the scale to 800 ppm to better meet the needs of programs engaged in measurements in urban and other high emission environments.
You can also read
Table 1: WMO primary standards, monometrically determined and X2019 assigned values. The X2019 assignments were determined following analysis and residual correction by laser-spectroscopy.
| Cylinder | Manometric (ppm) | Manometric std dev (ppm) | N | δ13C (‰) | δ18O (‰) | Assigned CO2 X2019 (ppm) | Year in service |
|---|---|---|---|---|---|---|---|
| AL47-110 | 246.730 | 0.079 | 30 | -6.8 | 0.1 | 246.688 | 1993 |
| AL47-102 | 304.495 | 0.099 | 31 | -7.5 | 0.2 | 304.445 | 1993 |
| AL47-111 | 324.134 | 0.116 | 38 | -8.0 | -0.3 | 324.105 | 1993 |
| AL47-130 | 337.403 | 0.087 | 31 | -7.6 | -0.5 | 337.412 | 1993 |
| AL47-121 | 349.515 | 0.089 | 28 | -7.7 | 0.1 | 349.520 | 1993 |
| AL47-139 | 361.054 | 0.056 | 30 | -8.5 | -1.6 | 361.032 | 1993 |
| AL47-105 | 369.523 | 0.104 | 33 | -9.2 | -1.8 | 369.549 | 1993 |
| AL47-136 | 381.487 | 0.092 | 34 | -10.1 | -3.0 | 381.537 | 1993 |
| AL47-146 | 389.731 | 0.100 | 35 | -10.7 | -4.0 | 389.782 | 1993 |
| AL47-101 | 396.495 | 0.130 | 34 | -11.2 | -4.5 | 396.483 | 1993 |
| AL47-106 | 412.231 | 0.103 | 34 | -12.2 | -5.7 | 412.249 | 1993 |
| AL47-123 | 423.218 | 0.112 | 32 | -12.9 | -6.8 | 423.264 | 1993 |
| AL47-107 | 453.255 | 0.144 | 37 | -14.6 | -9.6 | 453.248 | 1993 |
| ND17440 | 479.720 | 0.054 | 15 | -14.0 | -13.8 | 479.739 | 2010 |
| AL47-132 | 521.605 | 0.122 | 41 | -17.7 | -14.8 | 521.705 | 1993 |
| CC71578 | 549.571 | 0.091 | 15 | -15.2 | -12.7 | 549.516 | 2021 |
| CA08231 | 588.909 | 0.090 | 12 | -8.9 | -13.8 | 588.823 | 2021 |
| CB11054 | 720.288 | 0.126 | 11 | -8.5 | -19.2 | 720.319 | 2021 |
| CC71605 | 791.551 | 0.160 | 13 | -8.8 | -21.1 | 791.457 | 2021 |
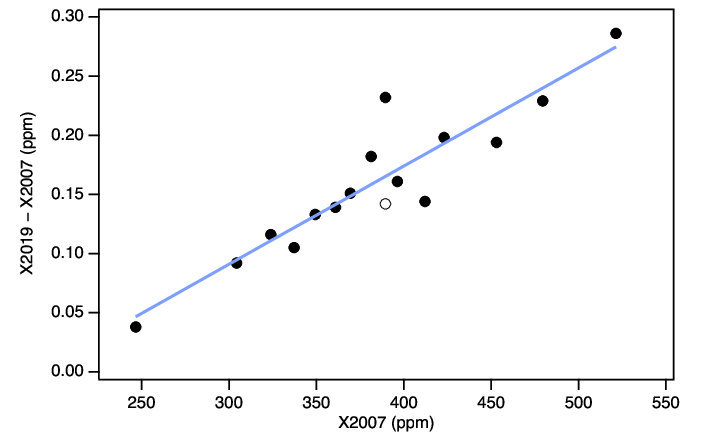
The difference between X2019 and the prior version of the WMO CO2 in air scale (WMO CO2 X2007) generally follows a linear mole fraction dependence with X2019 approximately 0.18 ppm higher than X2007 at 400 ppm.
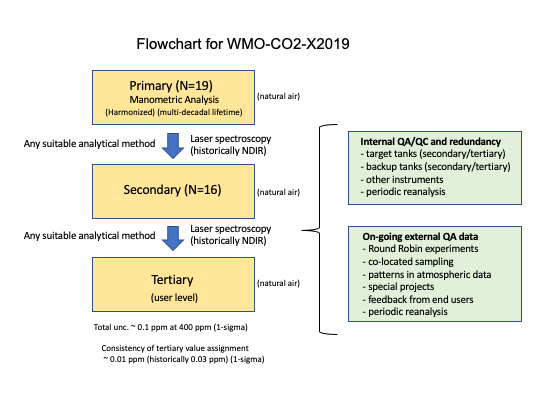
The scale is disseminated by calibration and distribution of natural air or modified natural air standards (https://gml.noaa.gov/ccl/airstandard.html). NOAA uses a strict hierarchy of calibrations (figure 2) to ensure traceability and a variety of QA procedures to ensure consistency of the scale propagation. Secondary standards are used in the hierarchy to extend the lifetime of the primary standards. Tertiary standards are distributed to the WMO community.
Prior to the scale revision released on February 8th 2021, NOAA calibrations and atmospheric data from ~1980 until NOAA became CCL in 1995 were partially or fully traceable to the SIO 99A scale (Keeling et al., 2002, 2012) through a single set of laboratory standards value assigned by SIO. To ensure consisitency in the NOAA atmospheric records, we have converted the calibration histories of these laboratory standards to X2019 using a linear scale relationship derived with the upcoming SIO X12 scale. This conversion and the uncertainty associated with it will be explored with future publications.
NOAA atmspheric records prior to ~1980 remain on the SIO scale in use at the time of the measurements. This time period corresponded with the use of CO2 in nitrogen standards which required large corrections to account for matrix effects in analyzer responses. The uncertainties associated with the corrections and the analytical methods used at the time are large compared to potential biases in the scales.