2018 News & Events
TOAR: New research reveals patterns of global ozone pollution
5 February 2018
adapted from the story by NOAA and CIRES Communications


Although ozone pollution is dropping across many parts of the United States, western Europe and Japan, many people living in those countries still experience more than a dozen days every year in which levels of the lung irritant exceed health-based standards.
That's one conclusion from a new health assessment based on the Tropospheric Ozone Assessment Report (TOAR), an effort by the International Global Atmospheric Chemistry Project to create the world's most comprehensive database of surface ozone observations from all available ozone monitoring stations around the globe. The paper was published today in the journal Elementa: Science of the Anthropocene.
The international scientists who compiled and analyzed the global ozone pollution database hope it will give scientists and public health managers better insight on trends and patterns of human health exposure around the world.
"TOAR is not just a report," said Owen Cooper, a CIRES scientist working at CSD who chairs the TOAR Steering Committee and has been working to develop the assessment since 2014. "We created the largest database of surface ozone from hourly observations at more than 4,800 monitoring sites worldwide, and we're making these data freely available to anyone who wants to investigate the impact of ozone on human health, vegetation, and climate."
Tropospheric or ground-level ozone is a greenhouse gas and air pollutant that, at high levels, is detrimental to human health and crop and ecosystem productivity. Ground-level ozone is a secondary pollutant, meaning that it is not emitted directly, but forms when sunlight triggers reactions between natural and human-caused chemical emissions, known as ozone precursor gases. Emissions from vehicles, power plants, industrial operations, and other human activities are a primary cause of surface ozone, which is one of six main pollutants regulated in the U.S. by the Clean Air Act.
Scientists have understood that the precursor gases that form ozone have been declining in North America and Europe since the 1990s, but levels have been increasing in Asia. However, limited and scattered ozone datasets left scientists unable to answer basic questions about the distribution and trends in ozone pollution in many parts of the world: In which regions of the world do people face the greatest ozone exposure? To what extent is ozone increasing in developing countries? Have air quality regulations reduced ozone levels in developed nations?
To address those and other questions, the TOAR research team has produced the first-ever global-scale scientific assessment of tropospheric ozone, based on all available surface observations and the peer-reviewed literature. Among the findings:
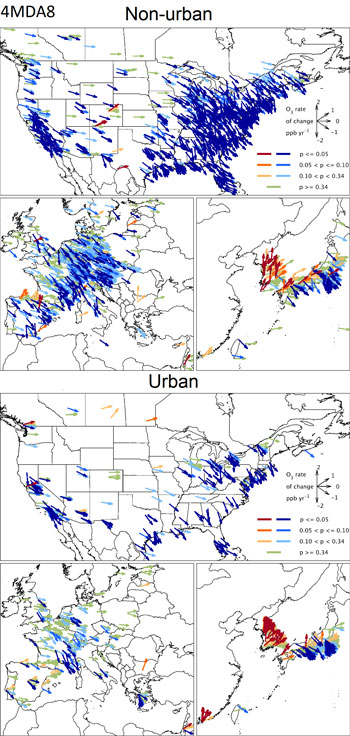
- Ozone levels across much of North America and Europe dropped significantly between 2000 and 2014.
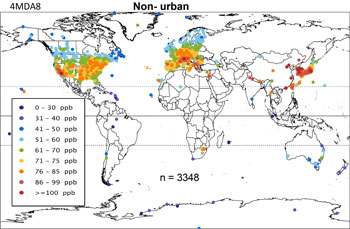
- Even so, during 2010-2014 people in parts of California, Arizona, Colorado, Texas, the Midwest and the Middle Atlantic still experienced more than 15 days a year in which ozone levels exceeded the U.S. health-based air quality standard of 70 parts per billion (ppb) averaged over eight hours.
- People living in parts of southern Europe, South Korea and southern Japan and China also experienced more than 15 days a year of ozone levels above 70 ppb.
- In some parts of Asia, Africa and South America, the researchers identified data gaps which prevented them from characterizing ozone pollution exposure patterns. However, overall, Southern Hemisphere sites tend to have lower ozone pollution levels, and fewer days above 70 ppb.
Despite some reductions in air pollutant emissions in Europe and North America, human health impacts from ozone are still a cause for concern across the world and are rising in parts of East Asia, with the potential for serious health effects on their populations," said Zoë Fleming, a researcher with the National Centre for Atmospheric Science at University of Leicester's Department of Chemistry. Fleming and Ruth Doherty of the University of Edinburgh were co-lead authors on the study, with co-authors from 12 international institutions.
Future TOAR studies will provide a global assessment of the ozone levels experienced by vegetation, observed ozone levels that affect climate and a historical analysis that explores how ozone levels have changed around the world since the early 20th century.
The TOAR database of surface ozone metrics is now publicly available and can be used by scientists and policymakers around the world to quantify the impacts of ozone on human health and vegetation.
TOAR is a project of the International Global Atmospheric Chemistry project, with support from NOAA, Forschungszentrum Jülich and the World Meteorological Organization.
Fleming, Z.L., R.M. Doherty, E. von Schneidemesser, C.S. Malley, O.R. Cooper, J.P. Pinto, X. Xu, A. Colette, D. Simpson, M.G. Schultz, S. Hamad, A.S. Lefohn, R. Moolla, S. Solberg, and Z. Feng, Tropospheric Ozone Assessment Report: Present day ozone distribution and trends relevant to human health, Elementa: Science of the Anthropocene, doi:10.1525/elementa.273, 2018.
Abstract
This study quantifies the present-day global and regional distributions (2010–2014) and trends (2000–2014) for five ozone metrics relevant for short-term and long-term human exposure. These metrics, calculated by the Tropospheric Ozone Assessment Report, are: 4th highest daily maximum 8-hour ozone (4MDA8); number of days with MDA8 > 70 ppb (NDGT70), SOMO35 (annual Sum of Ozone Means Over 35 ppb) and two seasonally averaged metrics (3MMDA1; AVGMDA8). These metrics were explored at ozone monitoring sites worldwide, which were classified as urban or non-urban based on population and nighttime lights data.
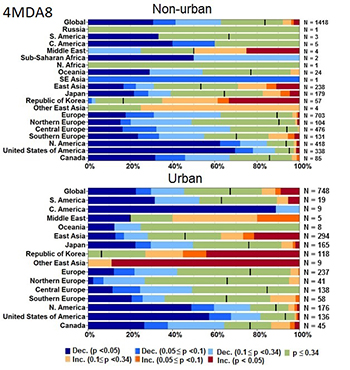
Present-day distributions of 4MDA8 and NDGT70, determined predominantly by peak values, are similar with highest levels in western North America, southern Europe and East Asia. For the other three metrics, distributions are similar with North–South gradients more prominent across Europe and Japan. Between 2000 and 2014, significant negative trends in 4MDA8 and NDGT70 occur at most US and some European sites. In contrast, significant positive trends are found at many sites in South Korea and Hong Kong, with mixed trends across Japan. The other three metrics have similar, negative trends for many non-urban North American and some European and Japanese sites, and positive trends across much of East Asia. Globally, metrics at many sites exhibit non-significant trends. At 59% of all sites there is a common direction and significance in the trend across all five metrics, whilst 4MDA8 and NDGT70 have a common trend at ~80% of all sites. Sensitivity analysis shows AVGMDA8 trends differ with averaging period (warm season or annual). Trends are unchanged at many sites when a 1995–2014 period is used; although fewer sites exhibit non-significant trends. Over the longer period 1970–2014, most Japanese sites exhibit positive 4MDA8/SOMO35 trends. Insufficient data exist to characterize ozone trends for the rest of Asia and other world regions.