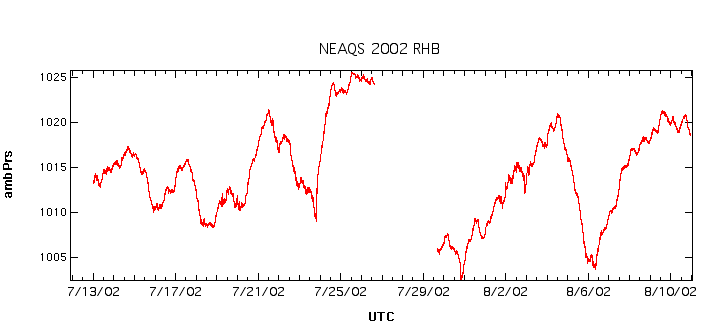
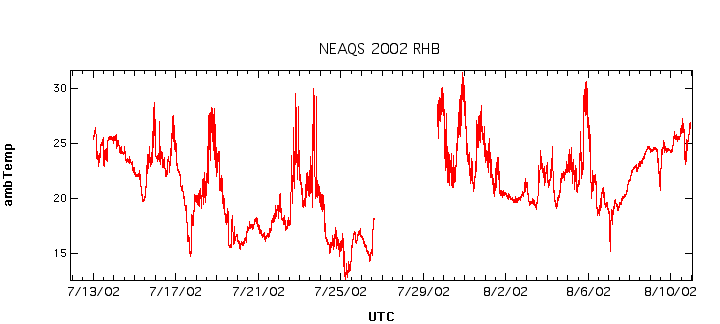
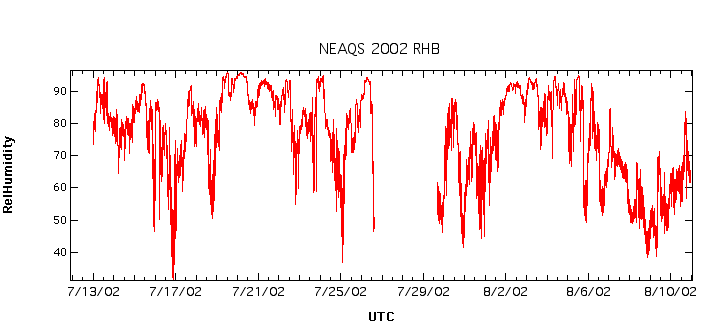
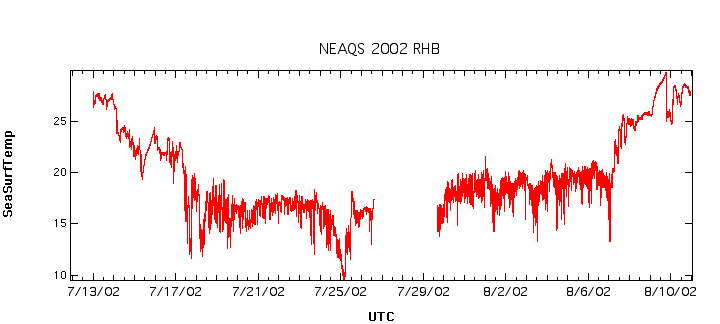
R/V Ronald H. Brown Data Plots
This list is a subset of all measurements made on the ship during the 2002 NEAQS project, and indicates the data available for download. Please refer to the instrumentation and Data ID table for measurements. For daily map and meteorology, refer to the Daily Summary.
All data and plots are in UTC. Not all data available for download will have a corresponding plot (png format).
| Ship | |
| DataID | Parameters |
| ShipMet |
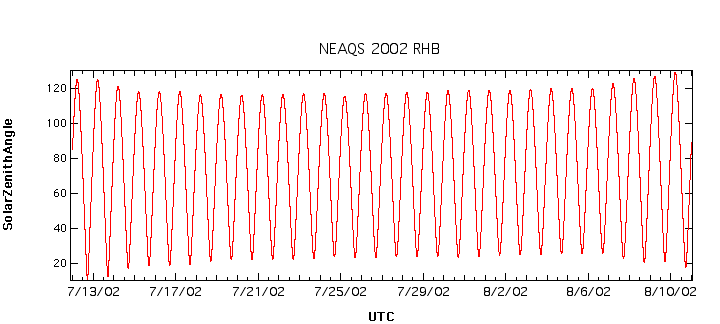
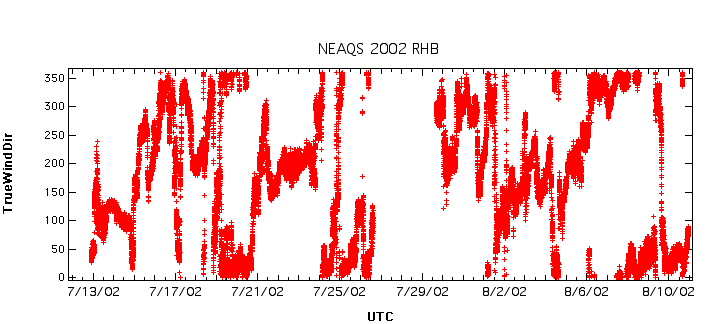
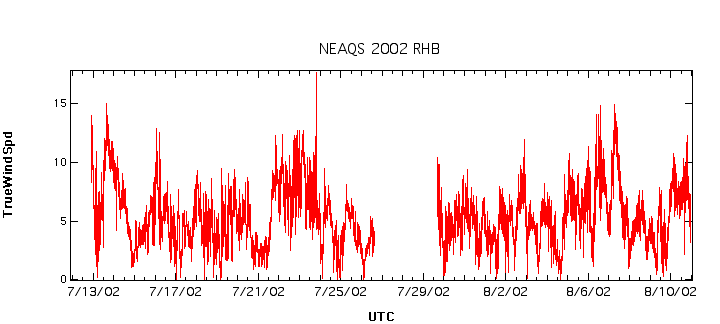
ambPrs ambTemp RelHumidity SeaSurfTemp SolarZenithAngle TrueWindDir TrueWindSpd |
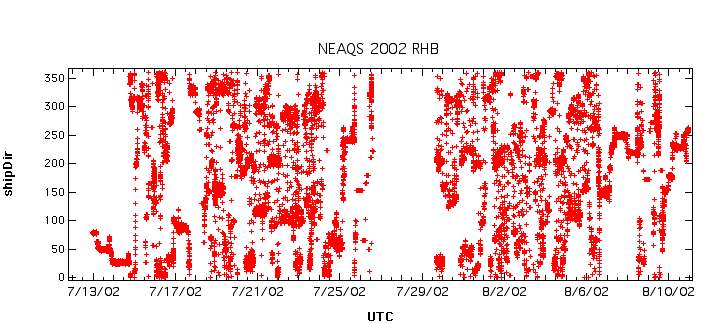
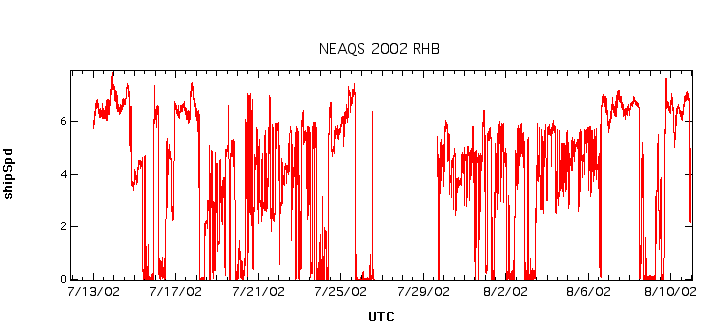
| ShipMis |
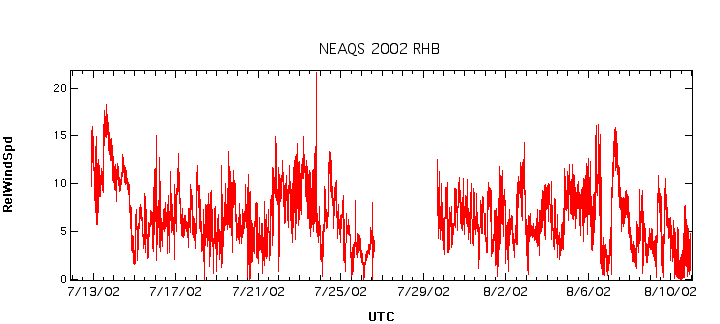
RelWindDir RelWindSpd shipDir shipSpd |
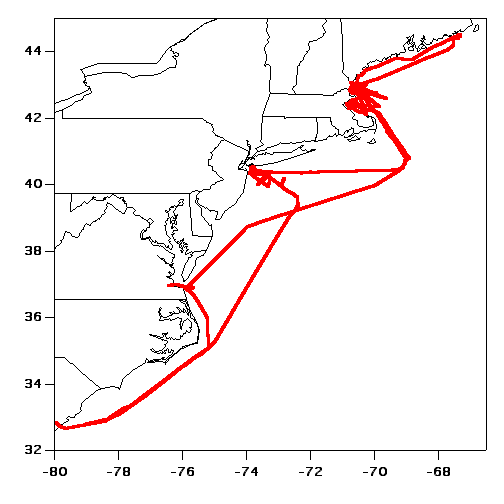
| ShipPos |
GpsLatGpsLon |
| Chem | |
| DataID | Parameters |
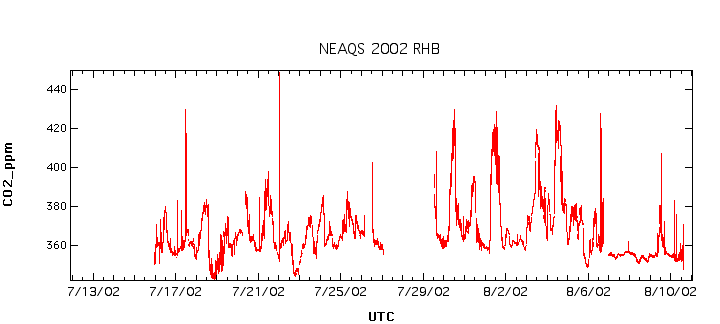
| CO2 |
CO2_ppm |
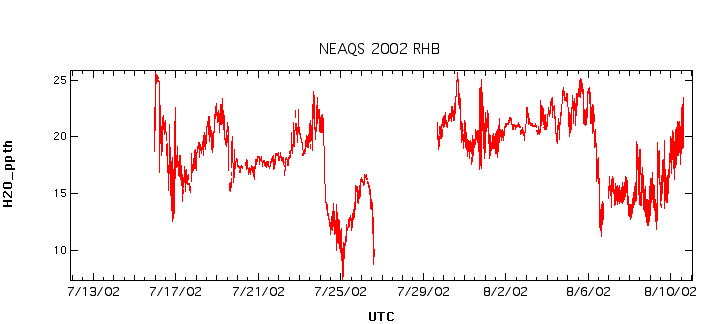
| H2O |
H2O_ppth |
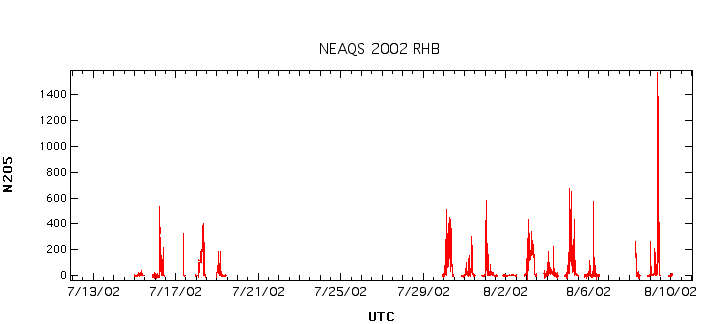
| N2O5 |
N2O5 |
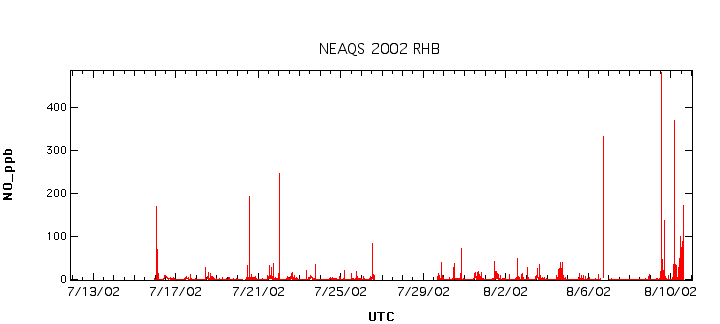
| NO |
NO_ppb |
| NO2 |
NO2_ppb |
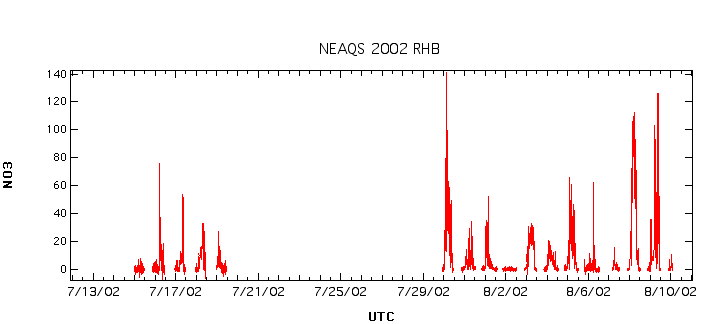
| NO3 |
NO3 |
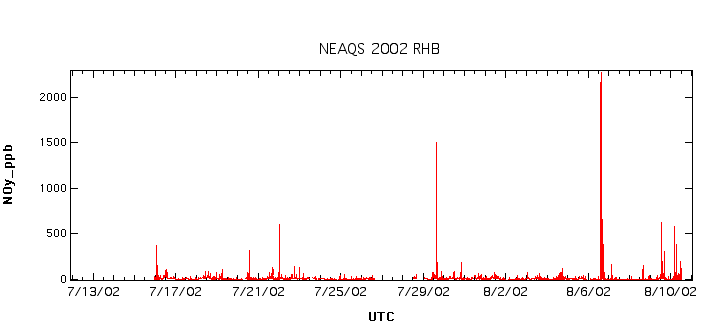
| NOy |
NOy_ppb |
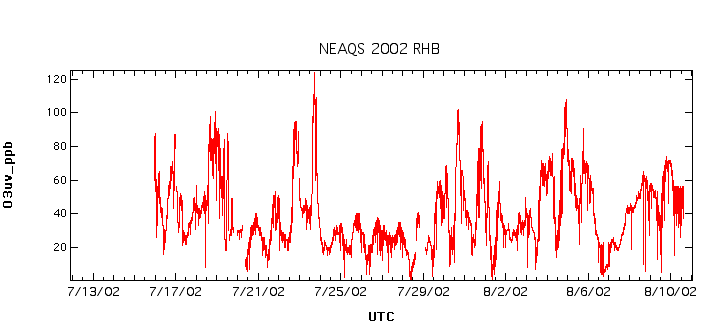
| O3uv |
O3uv_ppb |
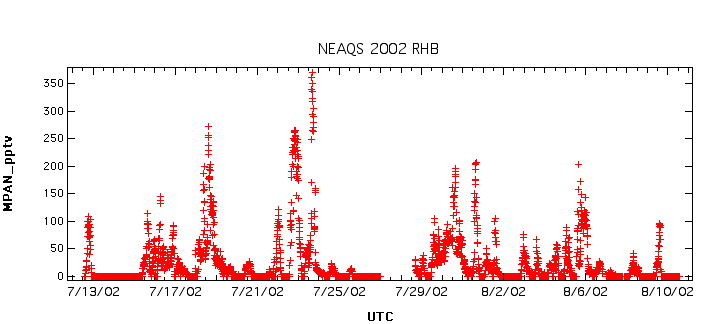
| PANs |
MPAN_pptv PAN_pptv PiBN_pptv PPN_pptv |
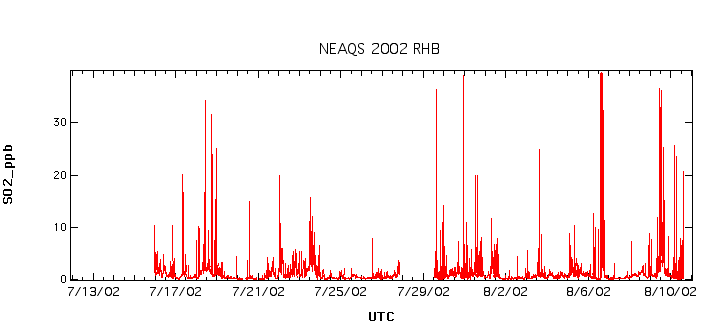
| SO2 |
SO2_ppb |
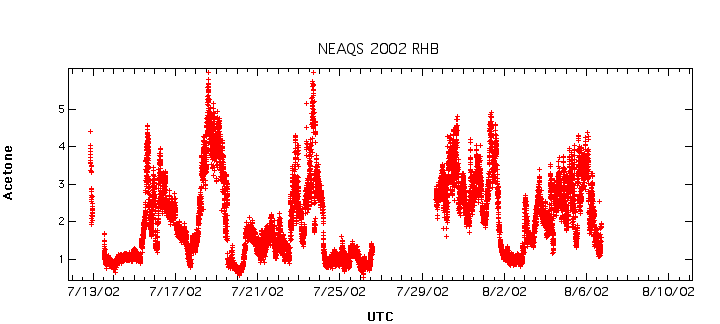
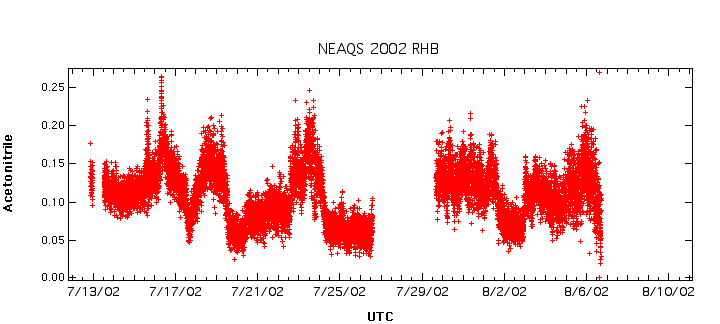
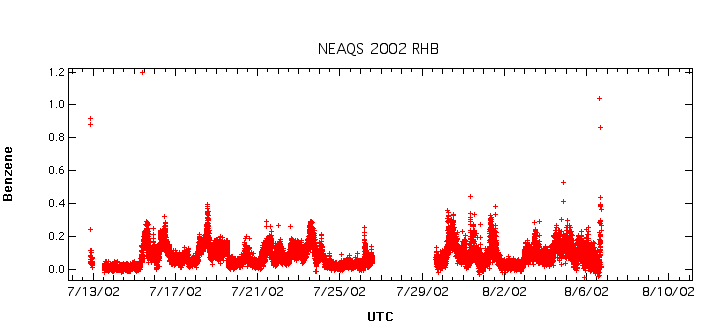
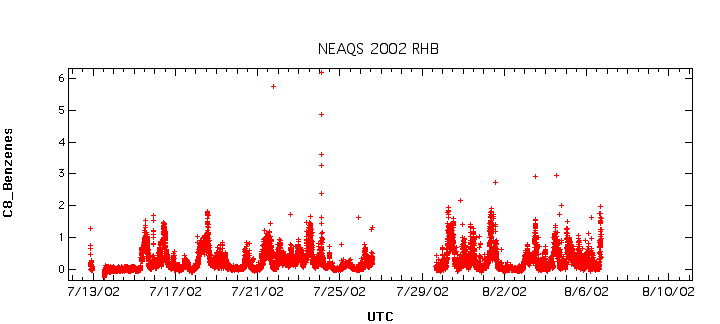
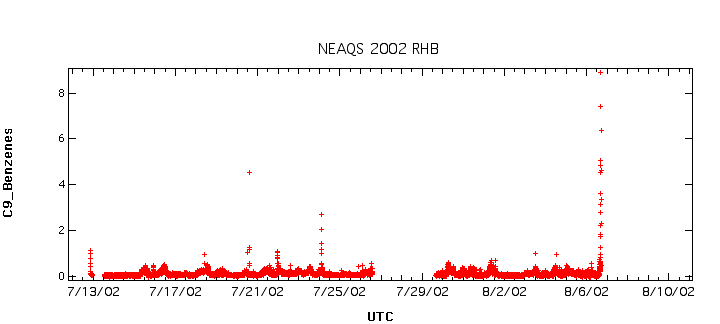
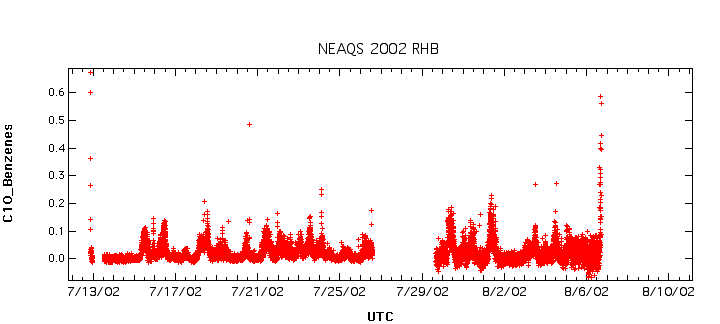
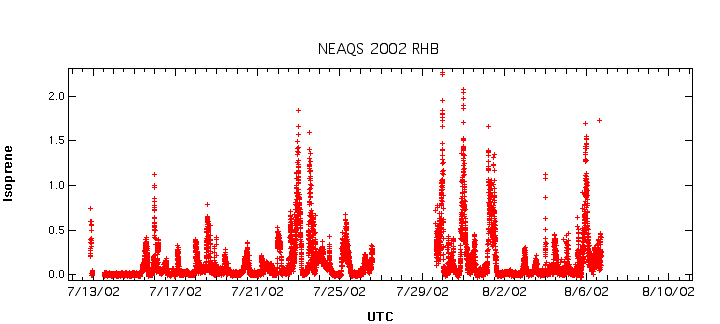
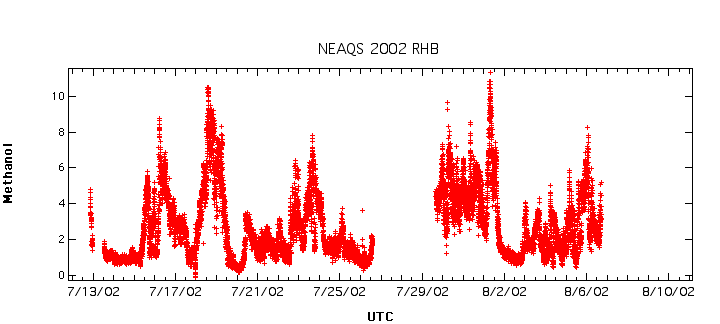
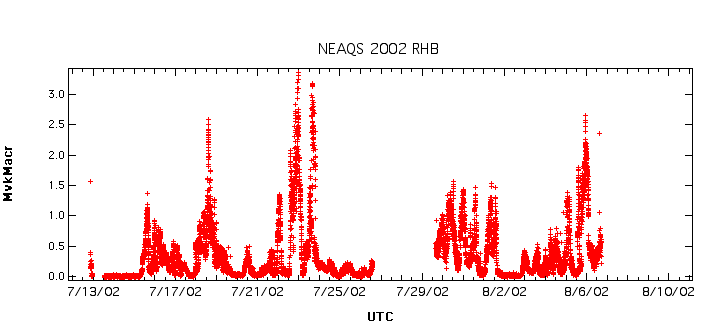
| VOCsPTRMS |
Acetaldehyde Acetone Acetonitrile Benzene C8_Benzenes C9_Benzenes C10_Benzenes Isoprene Methanol Monoterpenes MvkMacr |
| Aerosol | |
| DataID | Parameters |
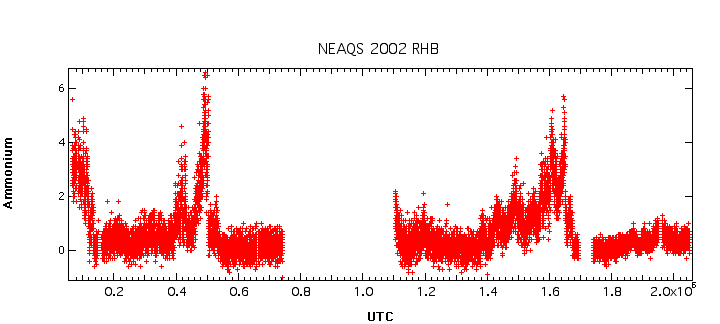
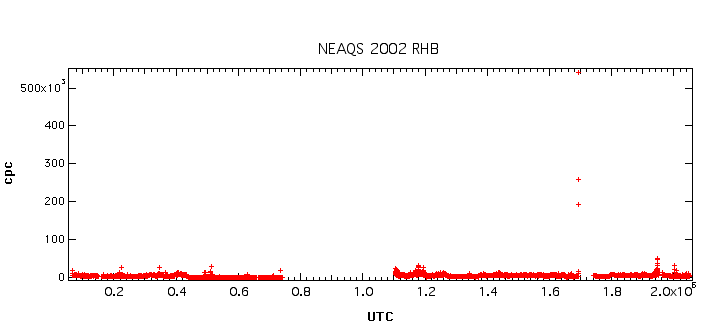
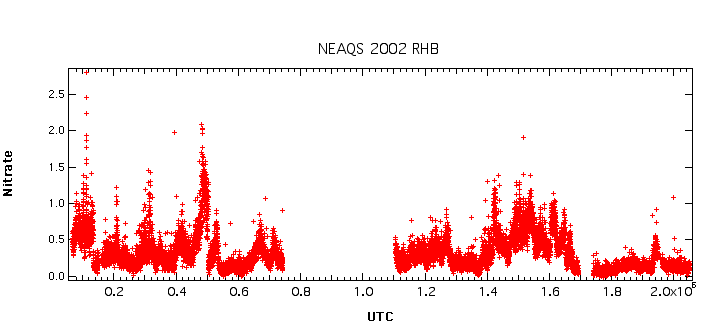
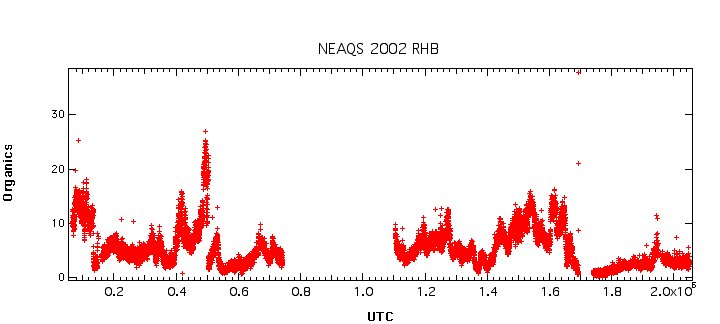
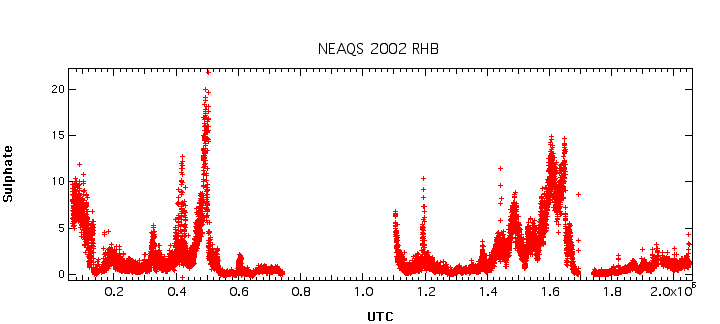
| AMS |
Ammonium cpc Nitrate Organics Sulphate |