R/V Ronald H. Brown Daily Summaries
Daily Summary August 5, 2002, DOY = 217
Winds shifted from SSE to SSW overnight with speeds ranging from 5 to 11 m/s. Aerosol light scattering (green) dropped from 140 to 80 mM-1. Ozone dropped to 55 ppb. Plumes of SO2 up to 8 ppb and spikes in CN were observed during the transects downwind of Cape Ann. The wind shifted from SSW to SW at 1330 with a rise in scattering (green) from 90 to 130. Sulfate concentrations were over 10 ug/m3. At 1430 the wind shifted back to the south. At 1830 the wind shifted to the W, relative humidity decreased from 95 to 65%, ozone concentrations decreased from the day's high of 90 ppb to 70 ppb, and aerosol light scattering (green) decreased from 130 to 110 mM-1. The ship altered course to stay perpendicular with the wind. This was presumably the surface front. We await the passage of the main cold front.
For all plots, time is indicated in GMT. Eastern time is -5 hours.
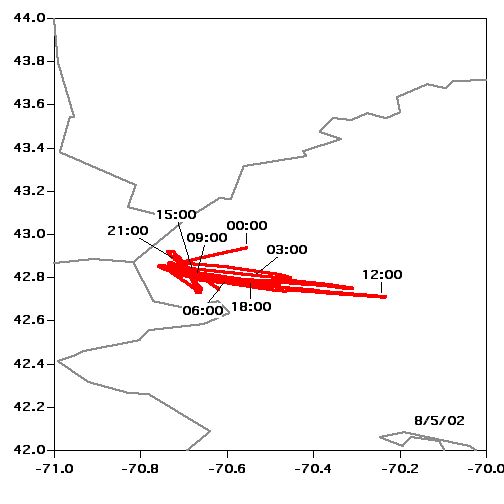 Location |
 Temperature, Pressure |
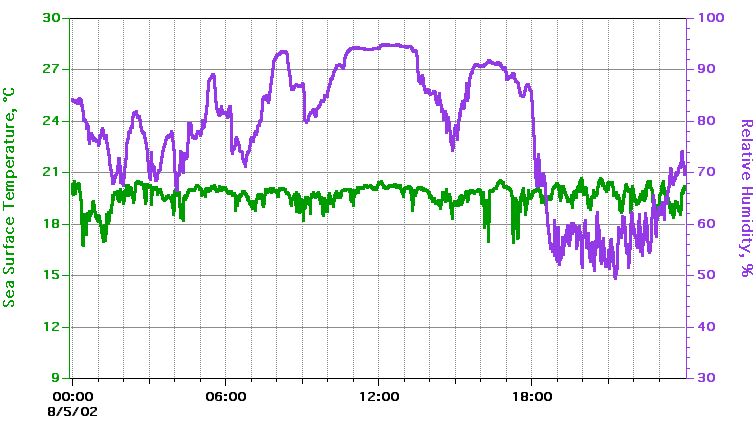 Sea Surface Temperature, Relative Humidity |
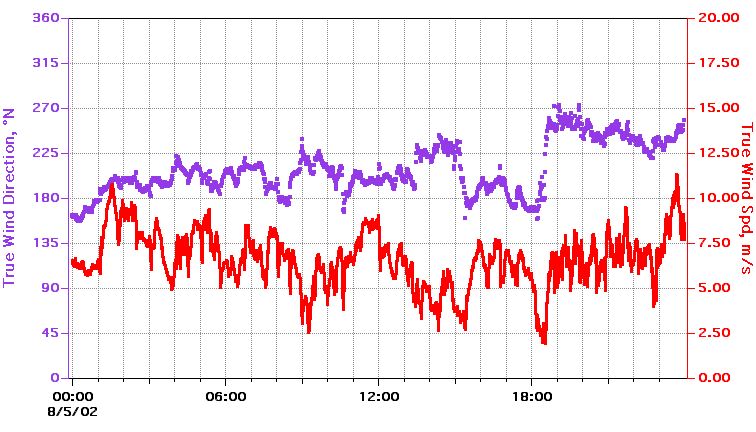 True Wind Speed, Direction |
 Ship Speed, Direction |
 Relative Wind Speed, Direction |
Textual information and data plots are for quicklook and overview purposes only.