SAGE III Ozone Loss and Validation Experiment (SOLVE)
SOLVE 2000 Mesoscale Exchange of Vortex Air
Project Overview
Adrian F. Tuck and Stephen J. Reid
NOAA Aeronomy Laboratory, 325 Broadway, Boulder, Colorado 80305-3328
History
Ozone laminae in ozonesonde profiles were first reported by Gordon Dobson (1973). The seasonal, altitudinal and latitudinal distributions of ozone laminae were studied by Reid & Vaughan (1991) using a far larger ozonesonde data set. This work indicated that many laminae originated in the polar regions, rather than at the subtropical tropopause break as speculated by Dobson. In fact, laminae move into mid-latitudes from both regions; laminae which are enhanced above the background ozone field are generally from high latitudes, whilst some (although not all) of those containing far less ozone than their surroundings originate in the subtropics. Figure 1 shows an enhanced ozone lamina recorded above Finnish ozonesonde station Sodankyla (67N, 23E).
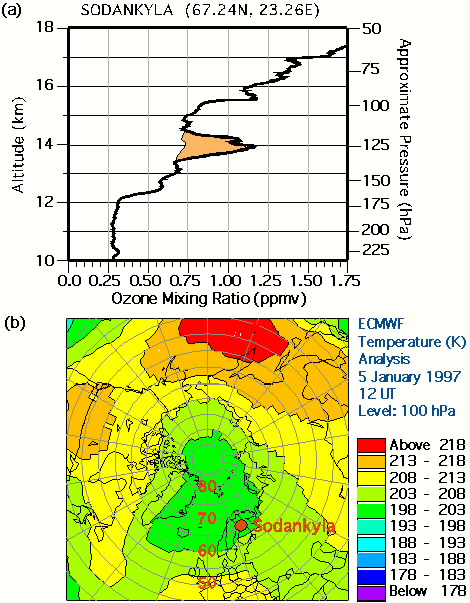
Figure 1a: Example of ozone lamina above station Sodankyla (67N, 23E).
Figure 1b: The polar vortex on the same day, its boundary located close to Sodankyla.
Transport of Ozone Laminae
The processes that control the transport of air into and out of the lowermost regions of the polar vortex during winter are still not fully understood. Mixing estimates contain substantial errors, perhaps because the ubiquitous occurrence of vertically-narrow layers in the tracer fields (laminae in one dimension; tracer sheets in two-dimensions) along the vortex boundary, which are too small to be adequately represented by atmospheric models, are playing a significant role in the exchange of vortex and extra-vortex air (Reid et al., 1998).
An ozone lamina was seen above Europe on 15th February 1995, spanning the isentropic surfaces 490-500K (figure 2a), corresponding approximately to an altitude of 19-20 km. Traced back using isentropic trajectories, the air passing over all these ozonesonde stations had come from a region around 80N, 60W (figure 2b), a location where the edge of the polar vortex was in contact with a large anti-cyclonic system over Canada, creating regions of large shear.
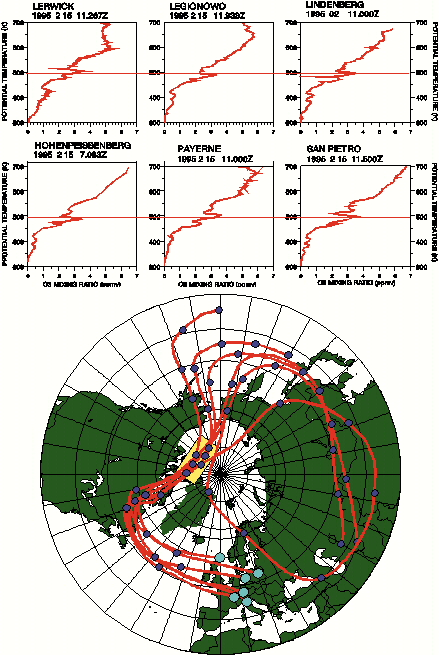
Figure 2: An ozone lamina observed almost simultaneously in 6 ozonesone profiles. This feature was traced back to a region of high shear at the edge of the polar vortex.
Contour Advection
Contour advection is an algorithm used for very precise tracer advection, in which material contours composed of many particles are advected using an accurate trajectory method (Norton, 1994). The particles are periodically redistributed so that fine-scale features in the contours are retained. A series of contour advection runs were started from 8th February 1995 on isentropic surfaces from 450K to 510K at 10K intervals. ECMWF analyses at a grid resolution of 3 x 3 degrees (corresponding to spectral resolution T42) were used. The contours were initialised using the potential vorticity (PV) field. In order to ensure that the contours represent approximately the same dynamical feature on all isentropes, the PV values at each level were scaled using the technique of Norton and Carver (1994) to provide the initial PV contours.
A large filament of PV, previously stripped from the polar vortex (not shown) by the strong shear produced by the blocking anticyclone over the north American continent, arrived over the U.K. at 12z on 14th February (day 6), and central Europe. By 12z on 15th February, the filament had encompassed all the stations where an ozone lamina was observed (figure 3).
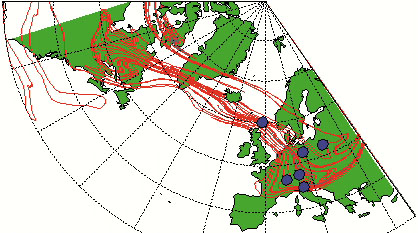
Figure 3: The results of a contour advection run initialised on 8th February at 490K, showing the position of a filament passing over Europe during the 15th February 1995 at 12 UT. The locations of the ozonesonde stations which recorded the presence on an ozone lamina around 490K are shown as light blue circles.
Ozone laminae abundance and Polar Temperatures
The abundance of ozone laminae varies in response to large-scale transport and stratospheric warmings, as indicated by figure 4 showing the January-mean interannual variation in the frequency of ozone laminae and the January-mean 30hPa temperature, averaged between 53N and the pole.
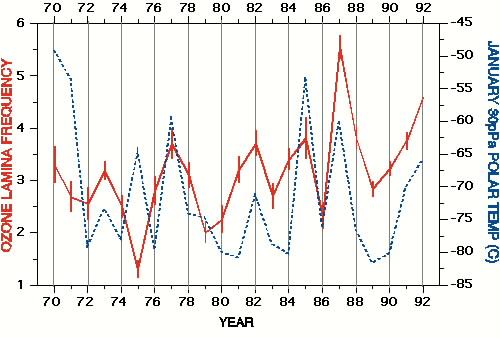
Figure 4: The January-mean annual frequency of ozone laminae for the period 1971-1992 (red curve) for latitudes poleward of 53N. The vertical bars are the stochastic errors based on the number of observations. The interannual abundance of stratification in the lower stratospheric tracer field reflects, to a large extent, the occurrence of stratospheric warmings, as indicated by the overall positive correlation between lamina frequency and the January monthly-mean polar temperature at 30 hPa (blue dotted curve).
Ozone Laminae and the Mid-latitude Ozone Trend
The vertical distribution of lamina frequency (defined by Reid & Vaughan (1991)) as the ratio of the number of laminae observed in ozone mixing ratio and the number of soundings made) during the period December May at the polar ozonesonde station Resolute (75N, 95W) (figure 5a) is compared with the vertical distribution of the negative trend in ozone, also derived from Resolute ozonesonde data. Figure 5b shows a similar situation in mid-latitudes using data from Hohenpeissenberg (48N, 11E) to compare the vertical distribution of laminae frequency (again in mixing ratio) with the ozone trend reported using the same ozonesonde data. The mid-latitude ozone trend derived from SAGE I and SAGE II satellite data are presented as triangles in figure 5b (adapted from the SPARC Assessment of Trends in the Vertical Distribution of Ozone, 1998). The similarity in these vertical distributions should not be interpreted as being causally related, but the results are suggestive.
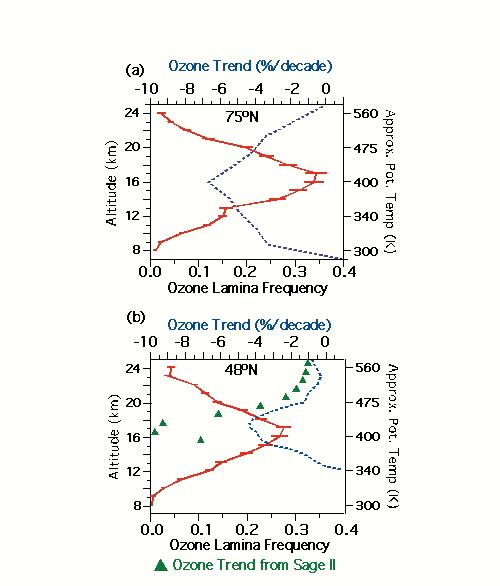
Figure 5a: the vertical distribution of the negative trend in lower stratospheric ozone, in percent per decade, at Resolute (75N, 95W), derived from ozonesonde data (broken curve), together with the vertical distribution of ozone mixing ratio lamina frequency during winter and spring (solid curve).
Figure 5b: the same as for figure 5a, but with ozone trend and ozone mixing ratio lamina frequency derived from ozonesonde data at Hohenpeissenberg (48N, 11E). The percentage mean decadal trend derived from revised SAGE I & II data is denoted by triangles.
Work During SOLVE
Tracer laminae are present throughout the winter, their numbers maximizing between 14 and 17km at the vortex boundary during February. At this time, aircraft, satellite and balloon-borne data will be employed to study the mesoscale exchange of air across the polar vortex boundary in the form of tracer laminae. The co-location of measurements from a number of different platforms will allow, for the first time, simultaneous observations of these features in two dimensions. The tracer, pressure and temperature profiles from SAGE III, if available, will provide valuable supplementary information in the regions where the aircraft flies, as well as elsewhere along the vortex boundary. The meteorological conditions prevalent during these observations will be used to initialize the University Corporation for Atmospheric Research (UCAR) mesoscale model, version 5 (MM5), to help identify the nature of the exchange mechanism(s).
References
- Dobson, G. M. B. The Laminated structure of the ozone in the atmosphere. Q. J. R. Meteorol. Soc., 99, 599-607, 1973.
- Norton W. A. & Carver G. D. Visualizing the evolution of the polar vortex in January 1992, Geophys. Res. Lett., 21, 1455-1458., 1994.
- Reid, S .J. and G. Vaughan. Lamination in Ozone Profiles in the Lower Stratosphere. Q.J.R.Meteorol. Soc., 117, 1991.
- Reid, S. J., M. Rex, P. Von der Gathen, I. Fløisand, F. Stordal, G. D. Carver, A. Beck, E. Reimer, R. Krüger-Carstensen, L. L. DeHaan, G. Braathen, V. Dorokhov, H. Fast, E. Kyrö, M. Gil, Z. Lityñska, M. Molyneux, G. Murphy, F. O'Connor, F. Ravegnani, C. Varotsos, J. Wenger and C. Zerefos. A study of ozone laminae using diabatic trajectories, contour advection and photochemical trajectory model simulations. J. Atmos. Chem., 30, 187-207, 1998.
- SPARC/IOC/GAW Assessment of Trends in the Vertical Distribution of O3. SPARC Report No. 1, WMO/GO3RMP No. 43, 1998.