R/V Ronald H. Brown Daily Summaries
Daily Summary August 1, 2002, DOY = 213
The ship transited from 42deg21min N, 069deg51min W to the IOS overnight. Particle number and SO2 concentrations were relatively low during the transit from 2230-0630 UTC. Beginning at 0630 the winds shifted to the NW and then west. Radon, SO2, hydrocarbons (anthropogenic and biogenic) and particle number increased. SO2 concentrations reached 8ppb in this airmass while O3 levels fell to a few ppb. These were the highest propane and isopentane concentrations observed during the entire project. This 'polluted' air mass lasted for about 3 hours (0630-0930) and then briefly ended almost as abruptly as it started. An hour later the concentrations of all these species again rose and were high until the winds shifted to the east at 1630. Early in this period isoprene and alpha pinene concentrations were elevated while later in this period MVK and methylnitrate were higher suggesting a more aged airmass later in the day. From 1100 to 2130 Brown ran a triangle course to study the land/sea breeze. The triangle included a leg parallel to shore 2 nm from the coast and an opposite point south of the IOS 6nm from the coast. Aerosol light scattering and ozone concentrations increased from 1200 to 1630 and then decreased with the easterly winds. At 2130 Brown headed offshore to sample the relatively clean marine air and make water.
For all plots, time is indicated in GMT. Eastern time is -5 hours.
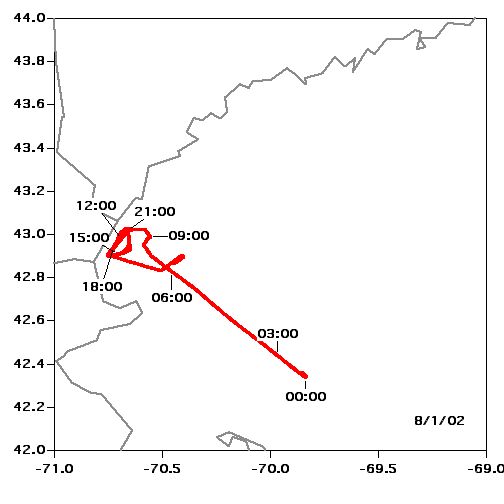 Location |
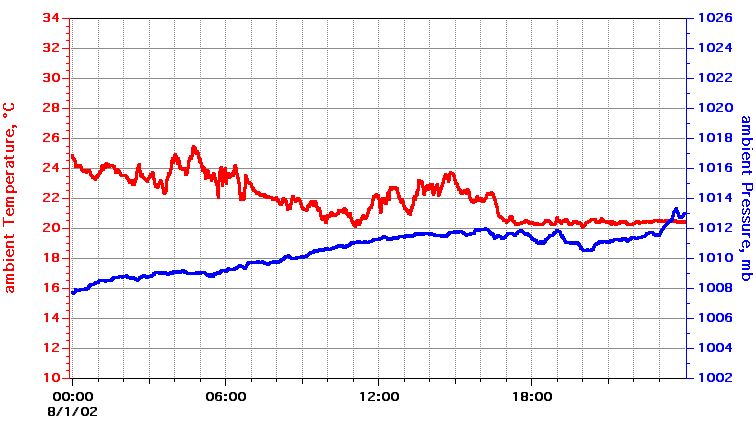 Temperature, Pressure |
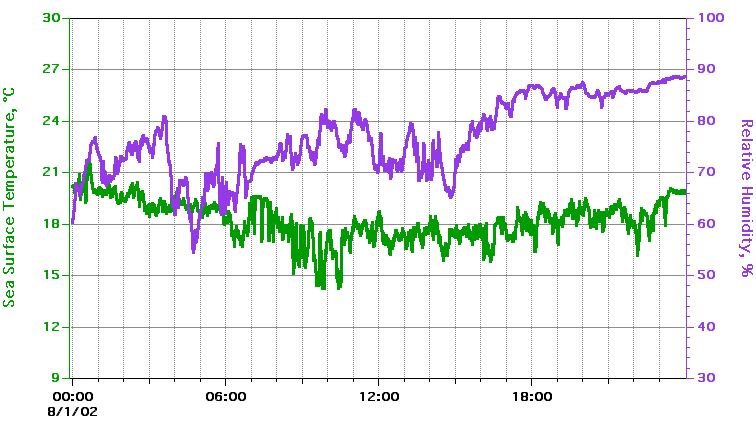 Sea Surface Temperature, Relative Humidity |
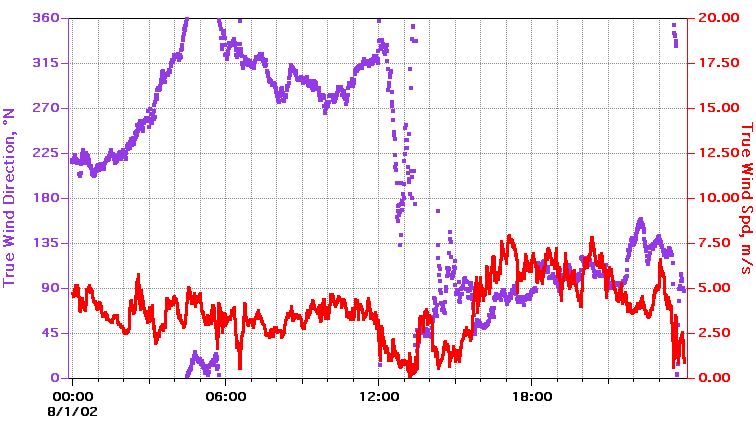 True Wind Speed, Direction |
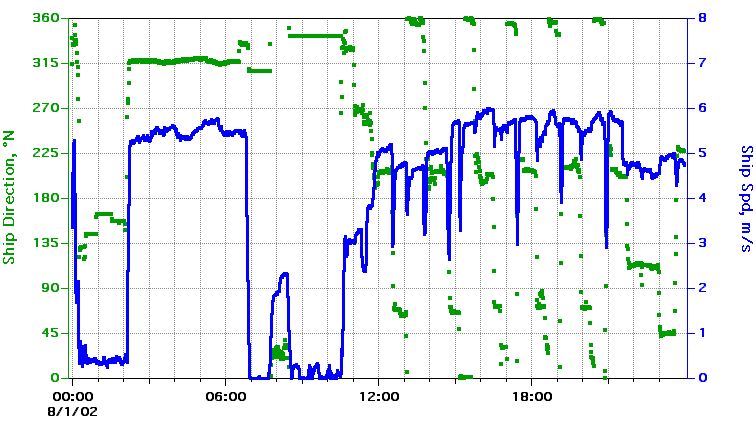 Ship Speed, Direction |
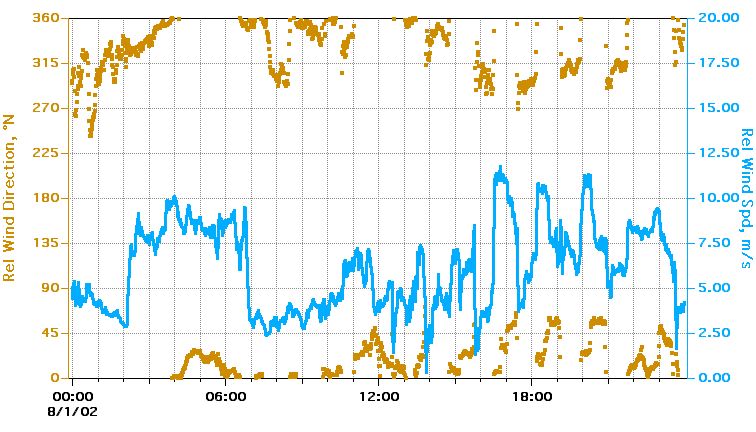 Relative Wind Speed, Direction |
Textual information and data plots are for quicklook and overview purposes only.