SHIPBOARD MONITORING OF STRATOCUMULUS CLOUD PROPERTIES IN THE PACS REGION
C. W. Fairall, A. S. Frisch, J. E. Hare, A. B. White, and A. A. Grachev
INTRODUCTION
The representation of clouds and their interactions with the Earth's radiation field are a major source of uncertainty in efforts to predict climate change through General Circulation Models (GCMs). Since oceans occupy roughly 70% of the surface of the earth, marine clouds are dominant contributors to the global radiation balance. However, marine clouds are dynamically, structurally, and microphysically distinct from continental clouds; thus, they present a host of new scientific problems. Radiative surface cooling associated with subtropical stratocumulus clouds and turbulent interfacial fluxes associated with stratocumulus boundary-layer dynamics are primary factors in producing the observed sea surface temperature structure of the Eastern Pacific. However, these cloud systems are notoriously difficult to properly simulate in GCMs. Boundary-layer structure, cloud optical properties, surface radiative fluxes, and cloudtop height are all directly dependent on the balance of fluxes at the bottom (surface) and top (entrainment) of the boundary layer. Whilst marine stratocumulus clouds have been heavily studied in the past, almost no data exists on clouds or air-sea fluxes in the PACS region. NOAA has recently initiated a program of study called EPIC that includes investigations of stratocumulus clouds in the PACS region. The EPIC science team is now developing plans for an intensive field program (called EPIC2001) for the fall of 2001.
BACKGROUND ON EPIC
The EPIC (Eastern Pacific Investigation of Climate Processes in the Coupled Ocean-Atmosphere System) program was born out of the inability of coupled ocean-atmosphere models to adequately predict the behavior of the atmosphere and ocean in the east Pacific region. EPIC [Weller, R., B. Albrecht, S. Esbensen, C. Eriksen, A. Kumar, R. Mechoso, D. Raymond, D. Rogers, and D. Rudnick, 1999: A science and implementation plan for EPIC: An eastern Pacific investigation of climate processes in the coupled ocean-atmosphere system. See http://www.atmos.washington.edu/gcg/EPIC/] is a part of the U. S. CLIVAR (Climate Variability and Predictability) program and consists of a combination of long term monitoring, intensive process studies, and modeling designed to increase our understanding of the east Pacific system and its interactions with its surroundings. EPIC has thus articulated an observational strategy for a PACS stratocumulus study based on three simple hypotheses:
- High-resolutions MBL models developed on California/Azorian stratocumulus are equally
usable on equatorial and Peruvian stratocumulus.
- Bulk parameterizations of radiative transfer properties (i.e., solar optical thickness, , and
longwave emissivity, , versus integrated liquid water content, W, and droplet or CCN
number density, N) that have been developed on NE Pacific and NE Atlantic stratocumulus
are applicable to equatorial and Peruvian stratocumulus.
- The stratocumulus cloud deck and cool SST underneath mutually reinforce each other
through coupled fluxes.
The EPIC observational strategy involves a combination of limited and comprehensive process studies, coupled with other oceanographic and meteorological studies of the equatorial region. Important information relevant to all three hypotheses can be obtained with modest, but spatially and temporally extensive, monitoring studies.
PROJECT GOALS
In this project we plan for a modest ship-based stratocumulus measurement program to obtain statistics on key surface, MBL, and low-cloud macrophysical, microphysical, and radiative properties relevant to the three EPIC stratocumulus hypotheses. There are two stages to typical cloud radiative transfer parameterizations used in GCMs: (1) representation of given a value for W, (2) input for computation of cloud optical properties (albedo, transmission, absorption) using a parameterized form of a radiative transfer code. One objective of our project is to determine the relationship of integrated cloud liquid water to cloud albedo and solar flux at the earth's surface in the broken cloud regime of the equatorial Pacific. The optical thickness of the cloud is a function of W and various microphysical processes often characterized through the size (or effective radius, re) of the cloud droplets. Through simple scaling arguments,
 = 3 W/(2 re) (1)
Effective radius profiles in stratocumulus clouds can be measured from the ship using a Doppler radar with sufficiently short wavelength.
Radiative effects are only a part of the coupled nature of this system. The SST is partly driven by the net radiative flux input to the ocean which is coupled to MBL turbulent and drizzle properties that influence cloud optical properties; the turbulent properties themselves are influenced by the MBL surface fluxes which link back to SST. Thus, we must consider MBL dynamics to get the correct value for W, cloud microphysics to get the correct value for , and radiative transfer to get the correct values of cloud albedo, transmission, and absorption. Furthermore, from a GCM point of view, it is necessary to MBL cloud state correct to get the correct values for the surface fluxes. Thus, a second objective involves the characterization of surface forcing and MBL structure in the stratocumulus regions.
Obviously, we cannot completely elucidate such a spectrum of complicated processes with our modest monitoring effort. Rather, our goal is to acquire a good sample of most of the relevant bulk variables that are commonly used in GCM parameterizations dealing with these problems. These will then be compared to known relationships in other well-studied regimes. While not comprehensive, this data will still be useful for MBL/cloud modelers (both statistically and for specific simulations) and to improve satellite retrieval methods for deducing MBL and cloud properties on larger spatial and temporal scales.
To summarize, our objectives are to:
Obtain new measurements of surface, cloud, and MBL statistics for simple comparison to existing data on northern hemisphere stratocumulus systems.
Obtain quantitative information on cloud droplet sizes plus properties and probability of occurrence of drizzle and possible links to deviations from adiabatic values for W.
Examine applicability of existing bulk parameterizations of stratocumulus radiative properties for the Peruvian/Equatorial regime.
Obtain basic data characterization of surface cloud forcing and possible ocean-atmosphere coupling through stratocumulus-SST interactions.
Provide periodic higher quality, more accurate near-surface data for intercomparison with ship-based IMET and buoy-based meteorological measurements.
Provide high quality measurements of basic surface, MBL and cloud parameters for 'calibration' of satellite retrieval techniques.
METHODOLOGY
We are conducting an enhanced monitoring cloud and MBL measurement program to supplement the measurements made on the NOAA ships (R/V's Ka'imi Moana and Ronald H. Brown) servicing the TAO buoys in the PACS region. The field program is built around regularly scheduled service visits to the 95 W and the 110 W buoy lines. The 95W line is in the main stratocumulus belt and the 110W line as at the western edge. An instrument package has been developed that can be installed on either ship. The instruments (see Table 1) consist of a cloud ceilometer, an S-band cloud/precipitation Doppler radar, a water vapor/liquid microwave radiometer, and an automated air-sea flux package including a sonic anemometer, a pair of pyranometers, a pair of pyrgeometers, slow air temperature and humidity sensors, and a ship-motion package for direct turbulent flux corrections. This set of instruments will allow computation of low cloud statistics (integrated liquid water content, cloud base height, and fraction) and the complete surface energy budget of the oceanic and atmospheric boundary layers. The cloud statistics by themselves will be of interest to cloud modelers and for improving satellite retrieval methods. When combined with measurements of downward longwave and shortwave radiative fluxes, they will allow computation of cloud IR and visible optical thicknesses plus the surface cloud radiative forcing, a key diagnostic variable in climate models. We plan an initial 3-year study and we anticipate two one-month deployments per year.
Interpretation of the link between cloud physical thickness and cloud radiative forcing requires information on the cloud microphysics (droplet size, number, total liquid water content). This link can be approximated from boundary layer thermodynamics properties using the adiabatic assumption. However, an unambiguous determination can be made using the ETL K-band mm-wave Doppler cloud radar in combination with the microwave radiometer using techniques developed in the ASTEX program. Thus, we will deploy the mm-wave cloud radar package on one cruise (Fall 2000) in the 3-year monitoring study. Specifically, we propose to make measurements to yield the following information:.
Cloud macrophysical statistics: cloud fraction, base height, top height, physical thickness
Radiative statistics: cloud transmission coefficient, cloud optical thickness, surface cloud radiative forcing (solar and IR)
MBL statistics: surface fluxes (turbulent, radiative), inversion height, mixed-layer properties
Simple MBL, cloud/radiative parameterizations: integrated liquid water path (W) vs the theoretical adiabatic value for a well mixed MBL (Wadiabat), cloud optical thickness vs f, W, cloud transmission coefficient and inferred albedo
Cloud effective radius vs W
Details on the instruments to be used are given in Table 1; items 9-11 will be deployed only once.
| Table 1. Instruments and measurements for proposed ship-based cloud/MBL monitoring. | ||
| Item | System | Measurement |
| 1 | Motion/navigation package | Motion correction for turbulence |
| 2 | Sonic anemometer/thermometer | Direct covariance turbulent fluxes |
| 3 | Mean SST, air temperature/RH | Bulk turbulent fluxes |
| 4 | Pyranometer | Downward solar radiative flux |
| 5 | Pyrgeometer | Downward IR radiative flux |
| 6 | Ceilometer | Cloud-base height |
| 7 | 0.92 or 3 GHz Doppler radar profiler | Cloud-top height, MBL microturbulence |
| 8 | Rawinsonde | MBL wind, temperature, humidity prof. |
| 9 | 35 GHz Doppler cloud radar | Cloud microphysical properties |
| 10 | 20, 31, 90 GHz wave radiometer | Integrated cloud liquid water |
| 11 | Upward pointed IR thermometer | Cloud-base radiative temperature |
RESULTS AND ACCOMPLISHMENTS
The first monitoring mission was completed in the fall of 1999. After loading the equipment in Seattle, the ship departed on Nov. 2 and, after a brief stop in San Diego, arrived in the PACS observing region on Nov. 11 (see Fig. 1). The ship transited the 110 W buoy line between Nov. 11 and Nov. 20, crossed to the 95 W line at 8 S, and transited the 95 W line from Nov. 23 to Dec. 2.
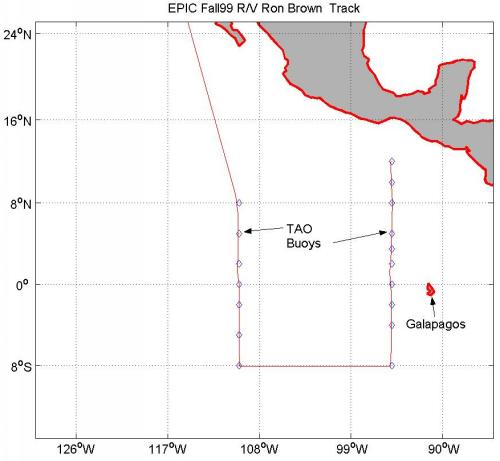
Figure 1. Cruise track for the fall 1999 mission on the R/V Ronald H. Brown. Only the PACS observing region part of the cruise track is shown. The diamonds represent TAO buoys.
Some preliminary analysis of the data is now available. The 110 W and 95 W lines are fairly similar. The sea-surface temperature is minimum (about 21 C) just south of the Equator (Fig. 2). Air temperature is about 1 - 2 C cooler, with a minimum sea-air difference also just south of the Equator. The surface winds show the typical structure in this region with a minimum over the cold tongue and a maximum well south of the ITCZ. The wind direction (Fig. 3) shows easterly flow at about 8 S turning to south easterly north of the Equator and then swinging to northerly on the north side of the ITCZ. We have computed the various components of the surface heat and moisture budgets (see Fig. 4). Except for a narrow region at about 3 N, the total heat input to the ocean is positive (i.e., warming the sea surface) with values at 1 S reaching an astounding 170 W/m2. Latent heat (evaporation) is a maximum of 130 W/m2 at the inflow to the ITCZ at 3 S (primarily associated with the wind speed maximum there).
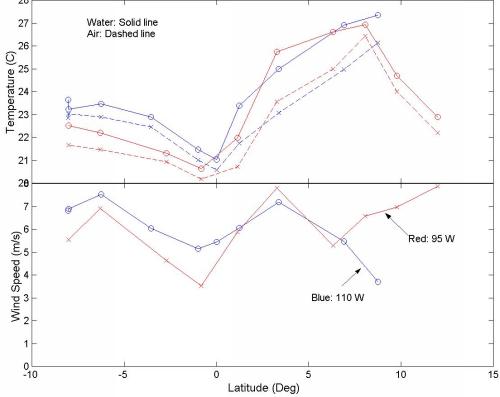
Figure 2. Summary of near-surface bulk meteorological components from the fall 1999 monitoring cruise on the R/V Ronald H. Brown. The temperatures are in the upper panel (water - dashed line; air - solid line) and wind speed in the lower panel as a function of latitude for the 110 W (blue) and 95 W (red) legs.
Figure 3. Summary of surface heat flux components from the fall 1999 monitoring cruise on the R/V Ronald H. Brown. Fluxes are plotted vs latitude for the 110 W (blue) and 95 W (red) transects. The upper panel gives the net radiation (x's, dashed), the sensible heat (o's), and latent heat fluxes (no symbol). The lower panel is the total net flux to the ocean.
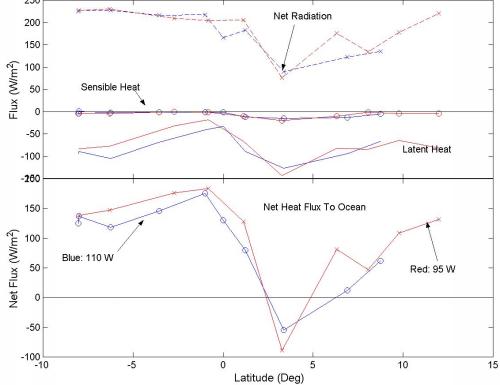
Figure 4. Summary of near-surface wind directions from the fall 1999 monitoring cruise on the R/V Ronald H. Brown. Mean wind direction is plotted vs latitude (blue - 110 W; red - 95 W longitude). The ITCZ is apparent as the region of rapid change in wind direction at about 6-8 N.
Preliminary analysis of the cloud data has produced some surprises. The following remarks apply to the transect at 95 W. Stratocumulus clouds were encountered just south and north of the equator, but they were rather optically thin. The lowest clouds (perhaps even fog) were actually south of the Equator on Nov. 26. The heaviest clouds were shallow (tops at 2.5 to 5 km) precipitating systems (as diagnosed with the S-band radar) found around 3 N at the end of Nov. 28 and early Nov. 29. These clouds caused the minimum in net radiation seen in Fig. 4. An example of the ceilometer output with low level stratocumulus clouds is shown for Nov. 27, just north of the Equator (Fig. 5). Complete ceilometer data (also flux data and various figures) can be obtained from the ETL ftp site (see below). Another way to highlight the effects of clouds is through their effects on the radiative surface fluxes (both IR and solar). In Fig. 6 we show average differences between the measured downward IR irradiance and a value computed for clear sky (i.e., what the flux would be in the absence of clouds). Clouds tend to enhance the downward IR, so regions with substantial low cloudiness are indicated by positive values in this graph. This data also shows the maximum in radiatively relevant clouds at 3 N. At this writing the S-band radar data processing is being completed and model calculations of clear sky solar radiative flux are being developed.

Figure 5. Sample daily summary graph of ceilometer statistics for Nov. 27 from the fall 1999 monitoring cruise on the R/V Ronald H. Brown. The upper panel has a dot plotted at each measured cloud-base height. The middle panel shows hourly cloud fraction. The lower panel the number distribution of cloud base heights for the day. MBL stratocumulus clouds are observed at the beginning and latter half of the day.
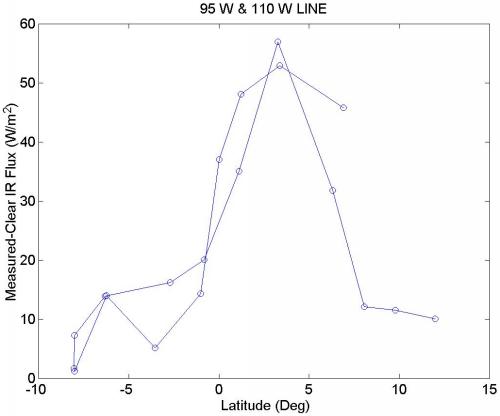
Figure 6. Summary of downward IR radiative flux from the fall 1999 monitoring cruise on the R/V Ronald H. Brown. The measured flux minus a model estimate for clear skies is plotted vs latitude for the 110 W (blue) and 95 W (red) transects. Large positive values indicate regions with low, optically thick clouds.
FUTURE WORK
At this writing, plans are underway for the spring 2000 cruise on the R/V Ka'imi Moana. The cruise track will be similar to the fall 1999 cruise conducted on the R/V Ronald H. Brown (as described above). Plans are also under development for the fall 2000 cruise on the Ron Brown. This cruise is the present target for the enhanced observations with the mm-wave cloud radar.
This group has combined with the lidar group at ETL and Ken Gage at the NOAA Aeronomy Laboratory to propose participation in the EPIC2001 intensive field program. EPIC2001 is a particular set of closely related process studies which are planned for a 6 week period between 15 July and 15 September of 2001 under the aegis of the overall EPIC program. These studies are focused on the dynamics of the cross-equatorial Hadley circulation along 95W, during the period in which it is strongest, and on associated processes which govern the SST and upper ocean structure. The National Science Foundation (NSF) and NOAA/PACS are cooperating in the funding of this project. This study be partitioned into 'bundles'', each dealing with a particular aspect of the problem. The four bundles respectively address
- the east Pacific ITCZ,
- the cross-equatorial ITCZ inflow,
- ocean processes, particularly in the east Pacific warm pool, and
- the southern hemisphere stratus region.
PUBLICATIONS RESULTING FROM THIS RESEARCH
CONTACTS
Principal Investigators:
C. W. Fairall
Chris.Fairall@noaa.gov
phone: 303-497-3253
fax: 303-497-6101
A. S. Frisch
Shelby.Frisch@noaa.gov
phone: 303-497-6201
fax: 303-497-6181
LINKS
Background on ETL group:
- http://www.etl.noaa.gov/et6/air-sea
ETL PACS/EPIC data site:
-
ftp://ftp1.esrl.noaa.gov/users/cfairall/EPIC/epic2001/
PACS Site:
- http://tao.atmos.washington.edu/PACS/
EPIC Science Plan:
- http://www.atmos.washington.edu/gcg/EPIC/
EPIC2001 Science Plan:
- ftp://kestrel.nmt.edu/pub/raymond/epic2001/overview.pdf