Bivariate EnSo Timeseries or the
"BEST" ENSO Index
Please reference timeseries using the paper:Smith, C.A. and P. Sardeshmukh, 2000, The Effect of ENSO on the Intraseasonal Variance of Surface Temperature in Winter., International J. of Climatology, 20 1543-1557.
Based on 1871-2001 SST and SOI indices

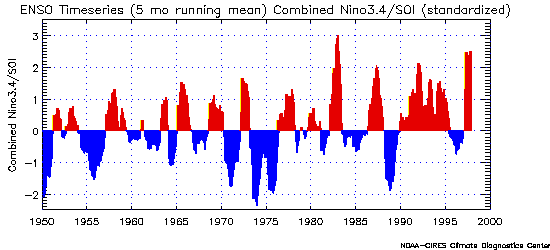
Get 5-mo running mean time series

Get 1-mo running mean time series (contains most recent monthly value)
Details on creating and reading the timeseries.
El Nino/La Nina years
Table of yearsAlternative (less stringent definition) table of years
El Nino/La Nina events can be taken from high/low values of the best index. Since either of the 2 variables in the index may dominate, a "better" method might be to use those months that correspond to both high Nino3.4 years and low SOI values (or vice versa). The table lists the months where both the SST and the SOI exceeded the 20th percentile (+/-1.28). El Nino=1, La Nina=-1, 0 for other,-9 is missing). It was created using the 1871-2001 data with a 5 month running mean applied. A less stringent definition uses the top/bottom 33% events or std=+/-.96 and is here.
Correlation of Index with Atm/Ocean variables
Winter(DJF) and Summer(JJA) 1958-2000
| ||||||||
| ||||||||
|


