We have made the decision to remove the AAM and GWO products from PSL website. These were research products, and the scientist who supported the pages has retired. We have no one currently at PSL who can support this activity.
You can access the code via ftp.cdc.noaa.gov/Public/csmith/AAM/ after emailing psl.data to restore the files/. However we cannot support the code in any way.
For those wishing to develop their own AAM products, these papers may be helpful:
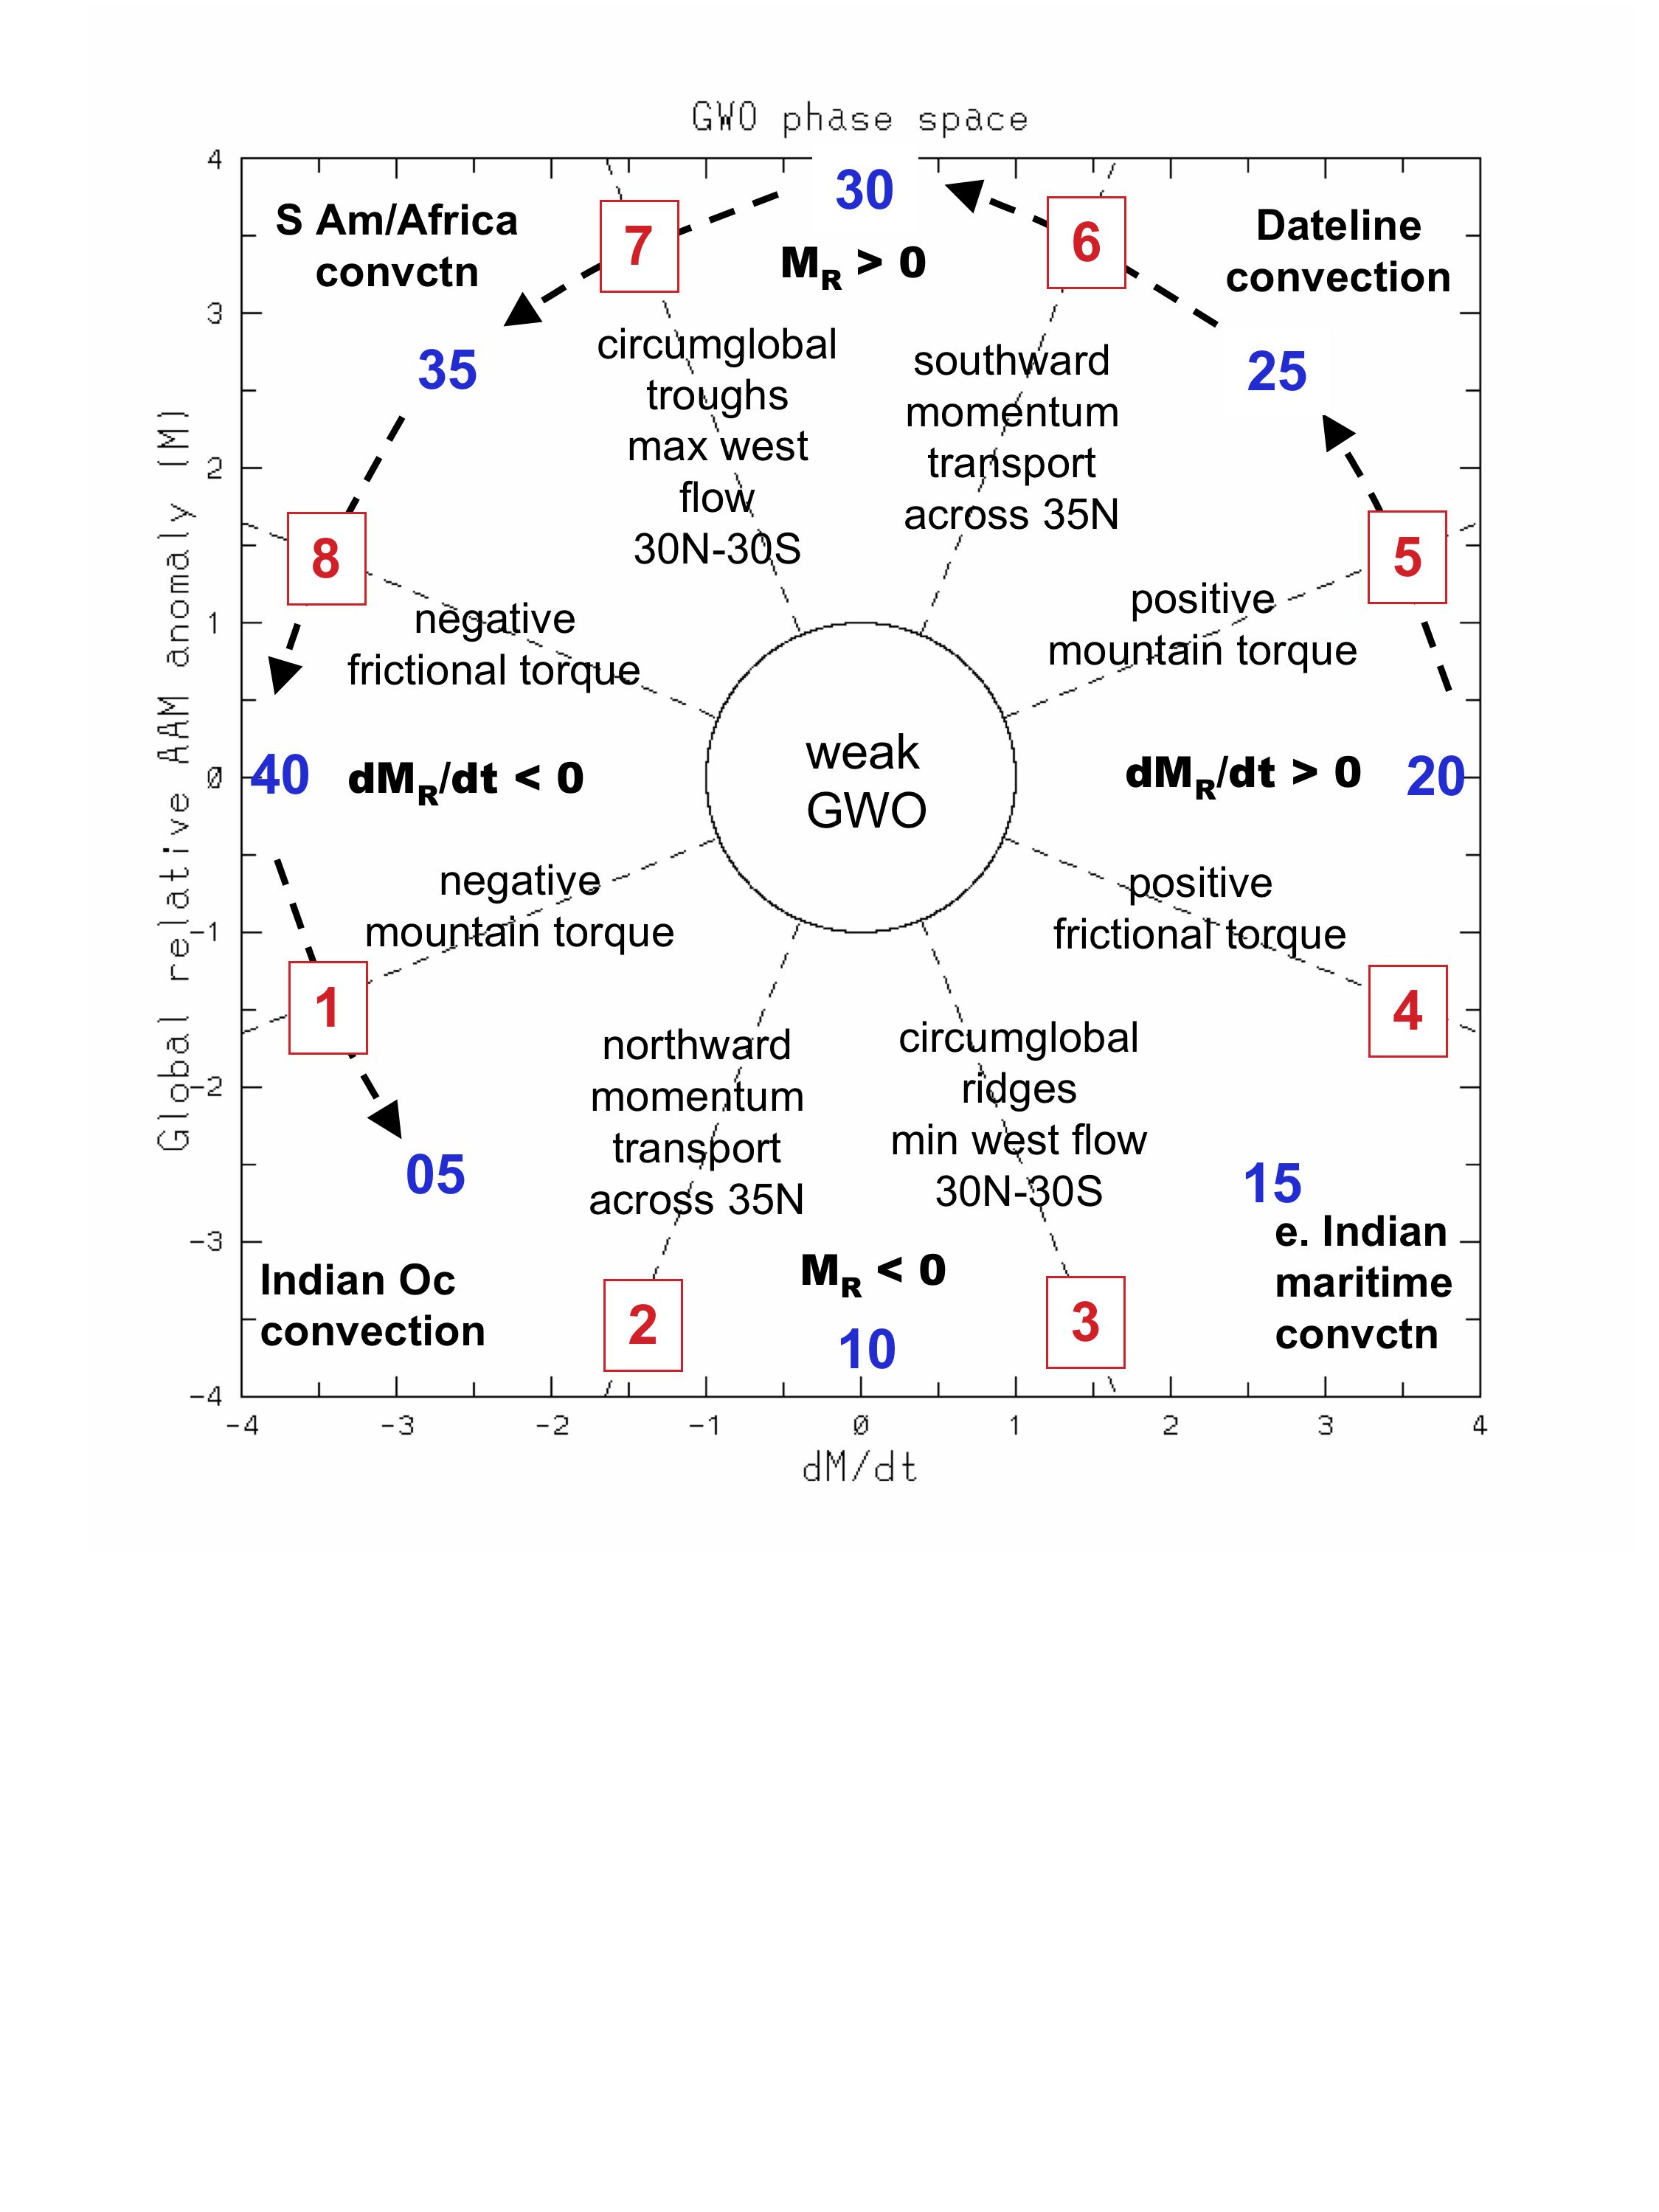
This quasi-phase space diagram plots standardized anomalies of global relative atmospheric angular momentum (AAM) on the y-axis and global relative AAM time tendency on the x-axis. The anomalies are based on a 1968-96 climatology and are standardized using 5-day average data from 1968-2006. A 5-day running mean is applied to daily data. The 5-day average standard deviation for global AAM is 1.2x1025 kg m2 s-1 and for the global tendency is 1.4x10¹⁹ kg m2 s-2. The global tendency is estimated from the global AAM time series using a 4th order (5-point) finite difference scheme. The scheme while highly accurate has problems when 5 points are not available. This and the 5-day running average means there will be changes in the last 4 points plotted when new data are added. The plotting routine was provided courtesy of Matthew Wheeler.
The diagram defines one component of the Global Synoptic Dynamic Model (GSDM) described in Weickmann and Berry (2007; WB07). This so-called global wind oscillation (GWO) is introduced in Weickmann and Berry (submitted; hereafter WB08). Another component of the GSDM is defined by the MJO and there is a link to its phase space plot on the webpage. The relation between the MJO and GWO is also described in WB08.
The GWO phase plot has been rearranged so that comparison with the MJO phase plot will be easier. WB08 describe how this was done. The figure below shows the WB08 phase definition as well as the stages used in WB07. In the future the WB08 phase definition will be used. The current plot orientation has low AAM states at the bottom and high AAM states at the top of the plot. A time evolving anomaly will be seen as a counterclockwise orbit in the GWO phase space. See WB08 for further discussion of the figure (link to pdf above)