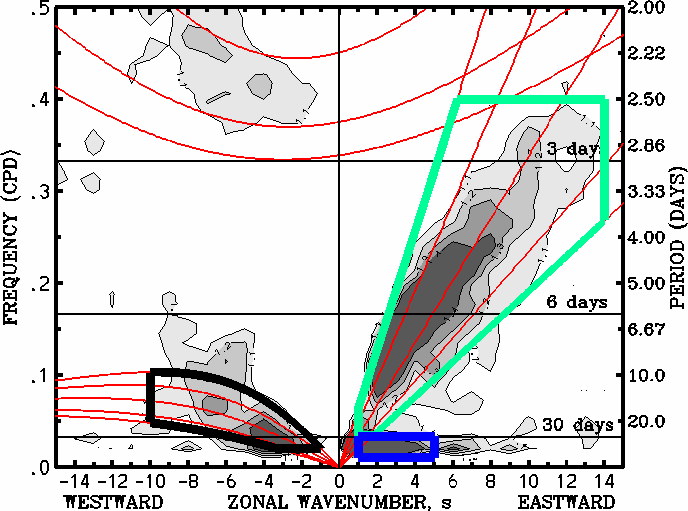
b) Regions of filtering for OLR S (Symmetric)

This figure, which is similar to Fig. 6b of Wheeler and Kiladis (1999), shows (with thick boxes) the regions of the wavenumber-frequency domain used for filtering of the symmetric component (w.r.t. the equator) of the satellite-observed OLR dataset. This filtering retrieves the longitude-time information of the convectively-coupled waves that have an symmetric OLR component. For the purpose of this real-time monitoring web-page, the only waves with an symmetric component that we are currently monitoring are the Kelvin wave, indicated by the green box, the n = 1 equatorial Rossby (ER) wave, indicated by the black box, and the Madden-Julian oscillation (MJO), indicated by the blue box. Note that the MJO is also defined in the antisymmetric component (Fig. a) of the OLR, unlike the equatorial waves. The thin red lines show the various equatorial wave dispersion curves (as in Matsuno 1966) for the five equivalent depths of h = 8, 12, 25, 50, and 90 m. The regions of filtering are also drawn such that the outlines are inclusive, meaning that the wavenumber or frequency where the edge of the region is drawn is included in the filtered dataset. So, as an example, for the MJO we include wavenumbers 1-5 and frequencies from 1/96 cpd through 1/30 cpd. Finally, the grey-scale shading represents the spectral peaks (w.r.t. a defined red background spectrum) obtained from a wavenumber-frequency spectral analysis of a multi-year record of the satellite-observed symmetric OLR, with the contours indicating the ratio of the calculated power relative to the background. The prominent spectral peak appearing for westward propagating ~2- to 3-day variance, that we do not include in the present filtering, is for the n = 1 westward inertio-gravity wave.