We have made the decision to remove the AAM and GWO products from PSL website. These were research products, and the scientist who supported the pages has retired. We have no one currently at PSL who can support this activity.
You can access the code via ftp.cdc.noaa.gov/Public/csmith/AAM/ after emailing psl.data to restore the files/. However we cannot support the code in any way.
For those wishing to develop their own AAM products, these papers may be helpful:
Composites are computed for all eight phases of the GWO and the MJO. A day is included in the composite if the indices have a magnitude of > 1 sigma. Composites will be computed for 91-day periods centered on each day of the year to bring out the seasonal changes in the anomaly structures, presumably a slow process. The GWO indices have been filtered with a 100-day high pass filter to focus on subseasonal events while the MJO indices are also high-pass filtered by subtracting a 120-day moving average, which removes interannual variability. The MJO indices are provided courtesy of Matt Wheeler.
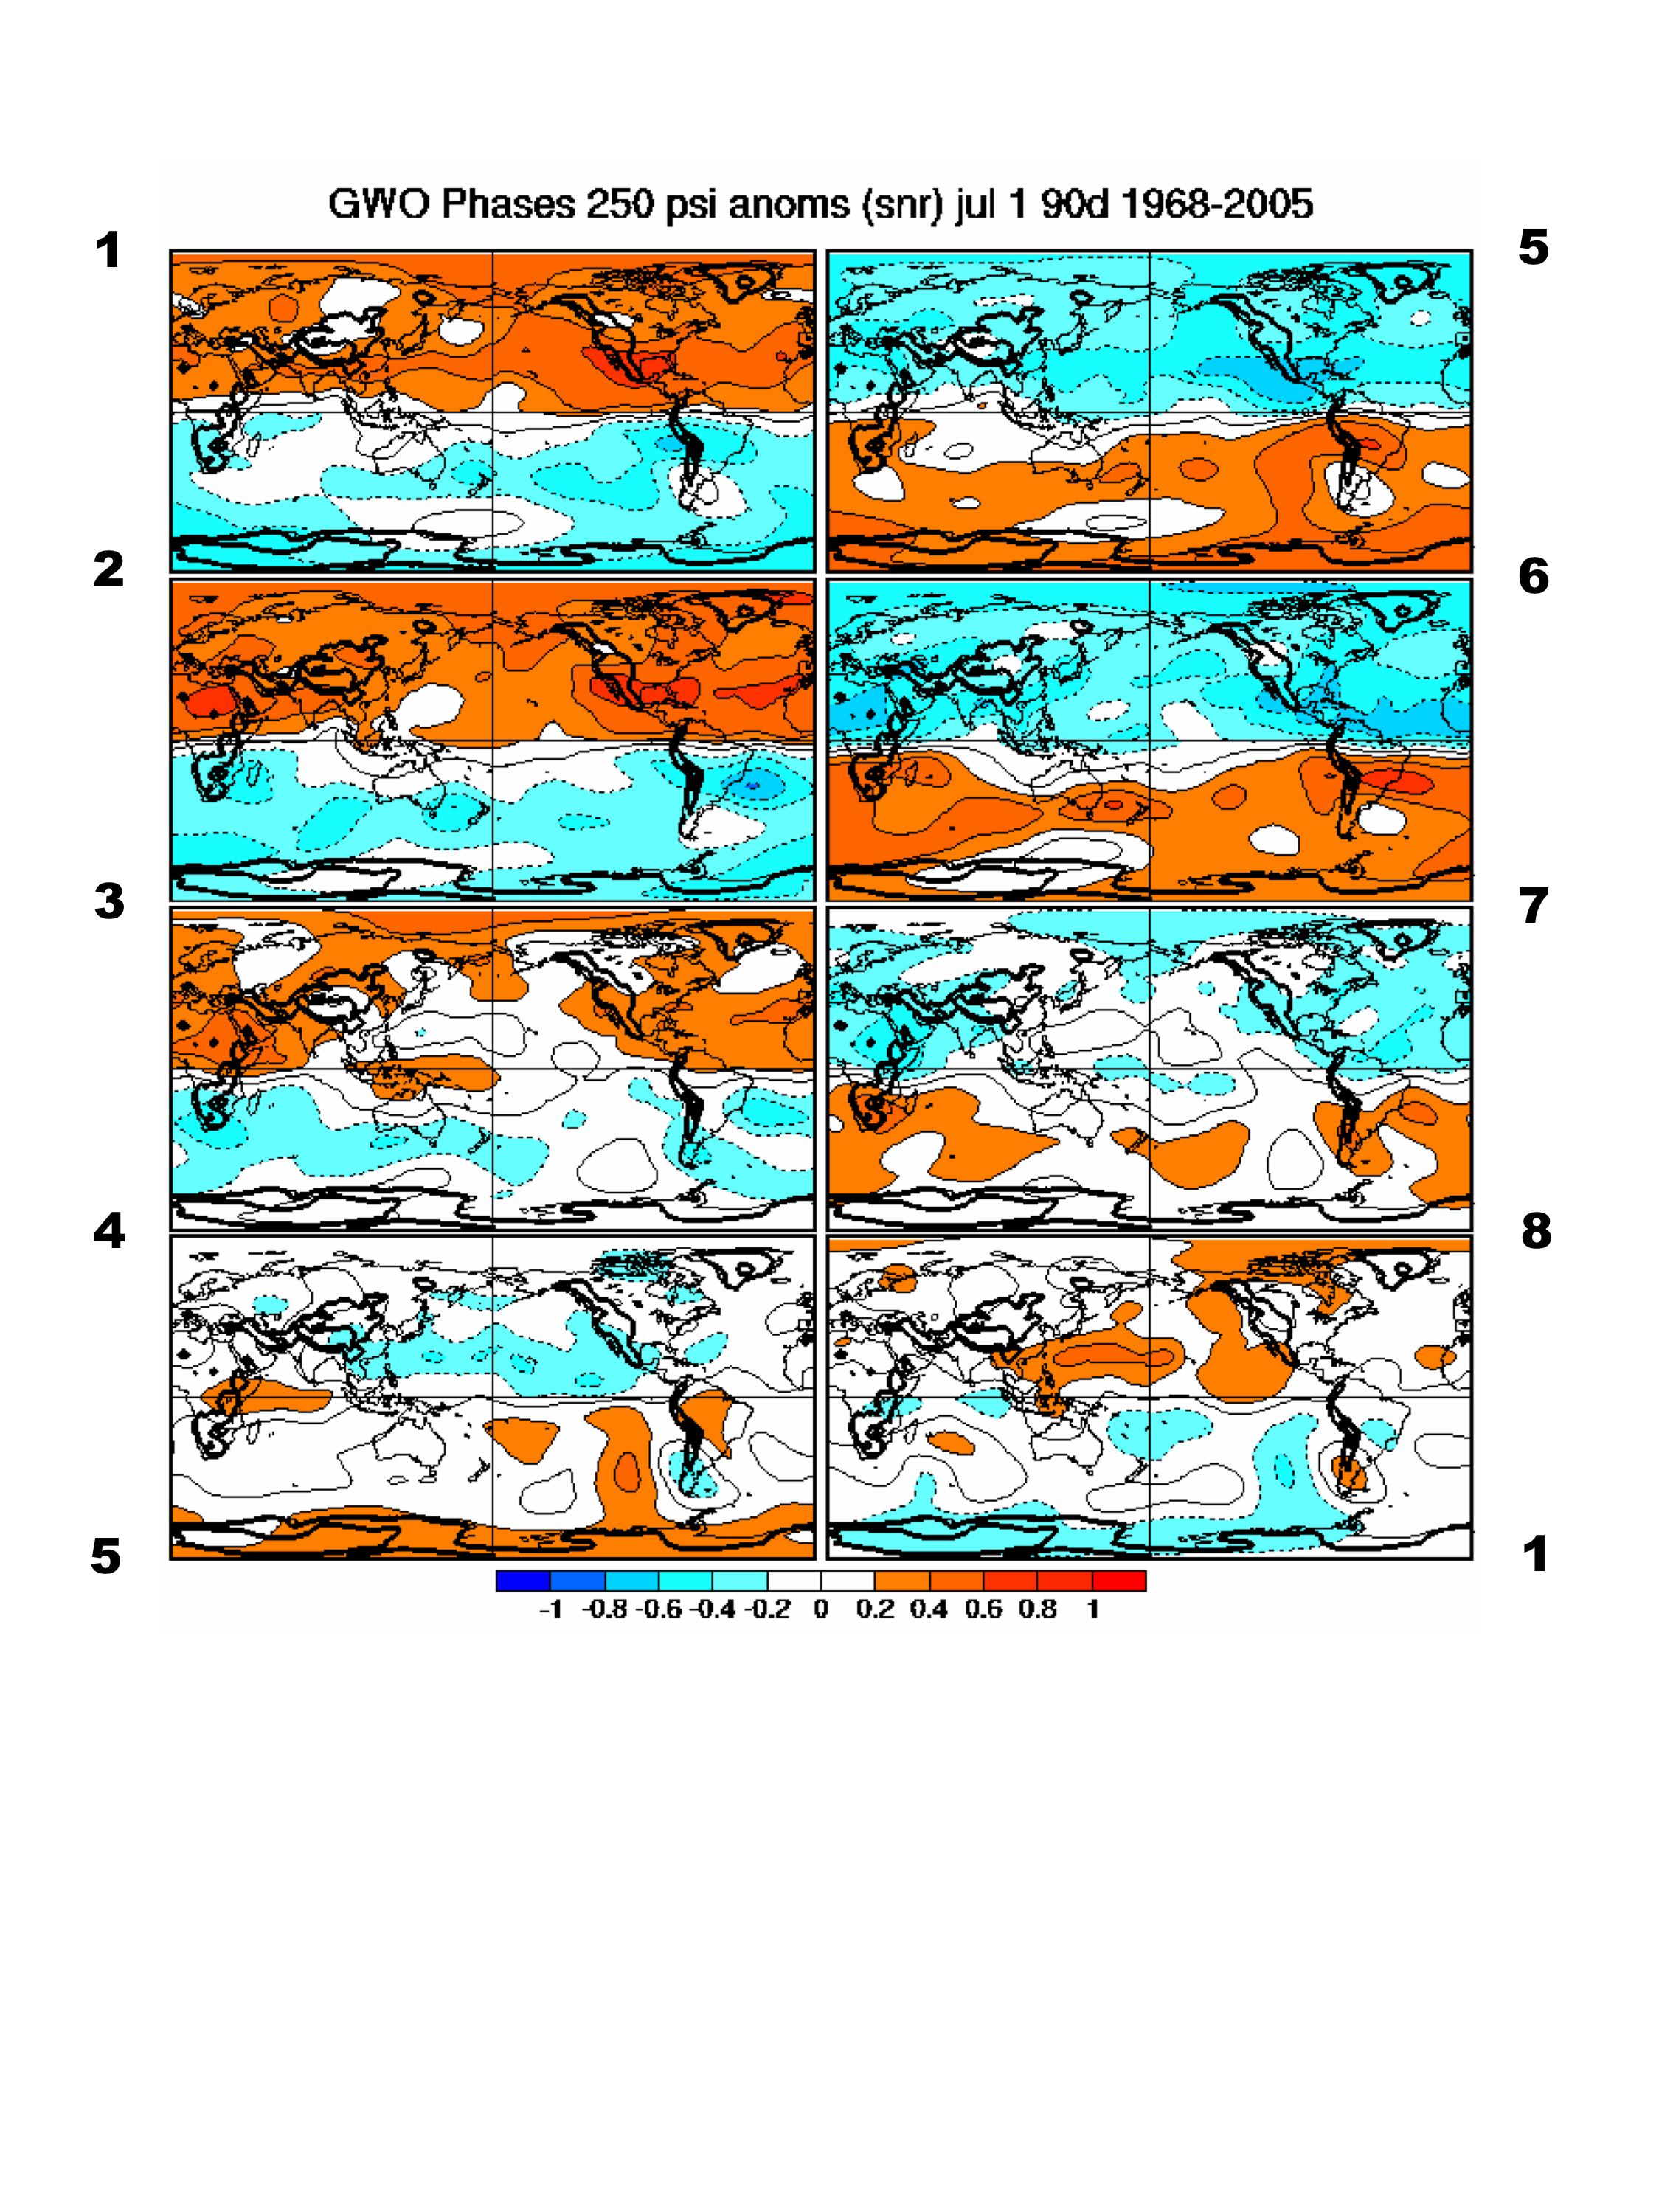
The variables depicted are 0.258 sigma streamfunction from the NCEP/NCAR reanalysis, outgoing longwave radiation from NOAA polar orbiters and 2 meter temperature from the NCEP NARR reanalysis. For convenience, the 0.258 sigma results are referred to as 250 hPa. The data have the seasonal cycle removed and the resulting anomalies are then normalized by their daily standard deviation. The standardized anomalies can be interpreted as the local signal to noise ratios (SNR) for a > one sigma value of the MJO or GWO index. If a Gaussian distribution is assumed, the standardized anomalies also give an estimate of the mean shift in the probability distribution function of the variable. The anomalies or SNRs are generally less than 1 sigma indicating the composite signals are relatively weak.
The phases for the MJO and GWO are now labeled on the composites to help relate the projection in the phase space to a large scale, coherent anomaly pattern. The blue and red shading in the streamfunction composites signify cyclonic and anticyclonic anomalies respectively over the northern hemisphere whereas blue and red over the southern hemisphere signify anticyclonic and cyclonic disturbances, respectively. The other variables have their usual meaning. Negative OLR anomalies siginify deep convection in the tropics and a combination of cloud and temperature effects going poleward.To estimate the impact of the ENSO cycle on the composite structures, we also constructed a composite for 17 May-14 August for those years with low atmospheric angular momentum anomalies. The composites below for 17 May-14 August can be compared with those on the webpage. La Nina is generally characterized by low AAM and El Nino by high AAM. The years used in the composite were determined by averaging the unfiltered GWO index for the 90 day period over which the composites are to be computed. If the average is > 0.5 sigma and the mean phase is between 2-3, it is designated a low AAM season (~La Nina). For an average phase between 6-7, it is designated a high AAM season (~El Nino). The results so far are only for the GWO and its behavior during La Nina-like, low AAM years.