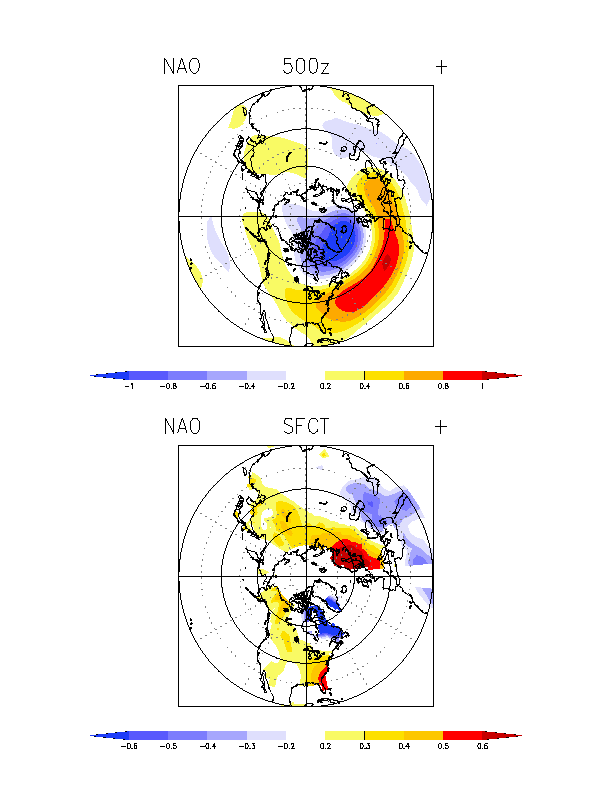
North Atlantic Oscillation (NAO)
- Description:
- Pattern of variability in the North Atlantic.
- Image:
- Calculation Method:
- The indices are based on centers-of-action of 500mb height patterns. These time series utilize the NCEP/NCAR R1 dataset. The area averaged region 55-70N;70W-10W is subtracted from 35-45N; 70W-10W. The 1981-2010 period was used as climatology. Before computing these indices the 500mb height fields are spectrally truncated to total wavenumber 10 in order to emphasize large-scale aspects of the teleconnections.
- Time Interval: Daily
- Time Coverage: 1948-near present
- Update Status: Daily
- Get Data:
- Update Status: Daily
-
NAO Timeseries
- Source:
- Data is from NOAA/ESRL PSL
- References/Info:
- Monthly NAO (different source)
- NOAA/CPC's NAO Information
