20th Century Reanalysis fields for November and December 2010 have been regenerated due to a misspecification of the sea surface temperature fields as of 25 May 2012. All derived files have been recomputed as of 18 June 2012. The re-run is supported by the US Department of Energy Office of Science
20th Century Reanalysis V2
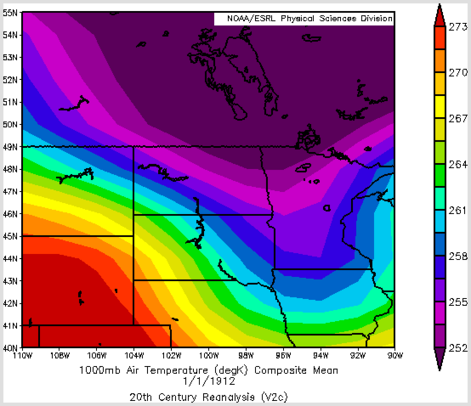
This plot shows the anomalous cold for the US Jan 1912.
Options to produce plot are using the Daily Composites 20th Century V2 Plotting page
- air temperature
- 1000mb
- January 1 1912 (0,6,12,18z)
- Means
- Map projection: custom 40-55N; 250-270E.
![]()