Arctic Data and Web Applications
PSL Arctic Region or Arctic Focus Datasets

Did you know...The first major effort by Europeans to study the meteorology of the Arctic was the First International Polar Year in 1882–1883. Eleven nations provided support to establish twelve observing stations around the Arctic. The observations were not as widespread or long-lasting as would be needed to describe the climate in detail, but they provided the first cohesive look at the Arctic weather.
PSL has a number of Arctic focused datasets and datasets that include the Arctic region that we make available to interested users.
- Gridded datasets with arctic coverage including four reanalysis datasets.
- Gridded observed and reanalysis datasets of ice concentration.
- AO (Arctic Oscillation) and the NAO from the monthly atmosphere/ocean timeseries webpage.
- Microphysical Retrievals: Files from the North Slope of Alaska and SHEBA projects.
Observatory FTP Data
- Alert, Canada FTP Data: See FTP links and datagrams on the Alert Observatory Page
- Eureka, Canada FTP Data: See FTP links and datagrams on the Eureka Observatory Page
- Tiksi, Russia FTP Data: See FTP links and datagrams on the Tiksi Observatory Page
- Summit, Greenland FTP Data : See FTP links and datagrams on the Summit Observatory Page
Arctic Web Applications
PSL has a number of web applications that can plot, extract and analyze various datasets. A few are specific to Arctic Datasets while some can be used with any of our gridded datasets. The ones of most interest to arctic researchers are:
Timeseries Extraction and Analysis
- Arctic Observatories Monthly Timeseries Extraction
Obtain monthly timeseries from gridded reanalyses that correspond to Arctic atmospheric observatory locations. Datasets include the NARR (North American Regional Reanalysis), NCEP/NCAR I Reanalysis and the NCEP/DOE II Reanalysis. - Daily Timeseries Extraction
Obtain daily timeseries from the NCEP Reanalysis or obtain days that satisfy user criteria (e.g. the highest 10% of January temperatures for a grid. - Climate-Related Monthly Timeseries Plotting
Page allows users to plot and compare index timeseries like the AO, the NAO, Nino 3 and many others. - NARR Plotting/Analysis (Monthly, Daily and 3-Hourly)
Plot means, anomalies and climatologies of data from the North American Regional Reanalysis. Different time periods can be averaged within a plot. Users can use climate timeseries like the AO to examine how the atmosphere and ocean relate to them. - Global Gridded Datasets Composites (Monthly, Daily, and 6-Hourly)
- 20th Century Reanalysis Composites (Monthly and Daily)
Plot values from the 20th Century Reanalysis which utilized surface temperature and pressure observations to drive a full atmospheric model. Dataset starts in 1908.
Maps and Crossections of Gridded Datasets
- Correlations with Monthly Timeseries
Plot timeseries correlations like the AO with atmospheric or ocean datasets.
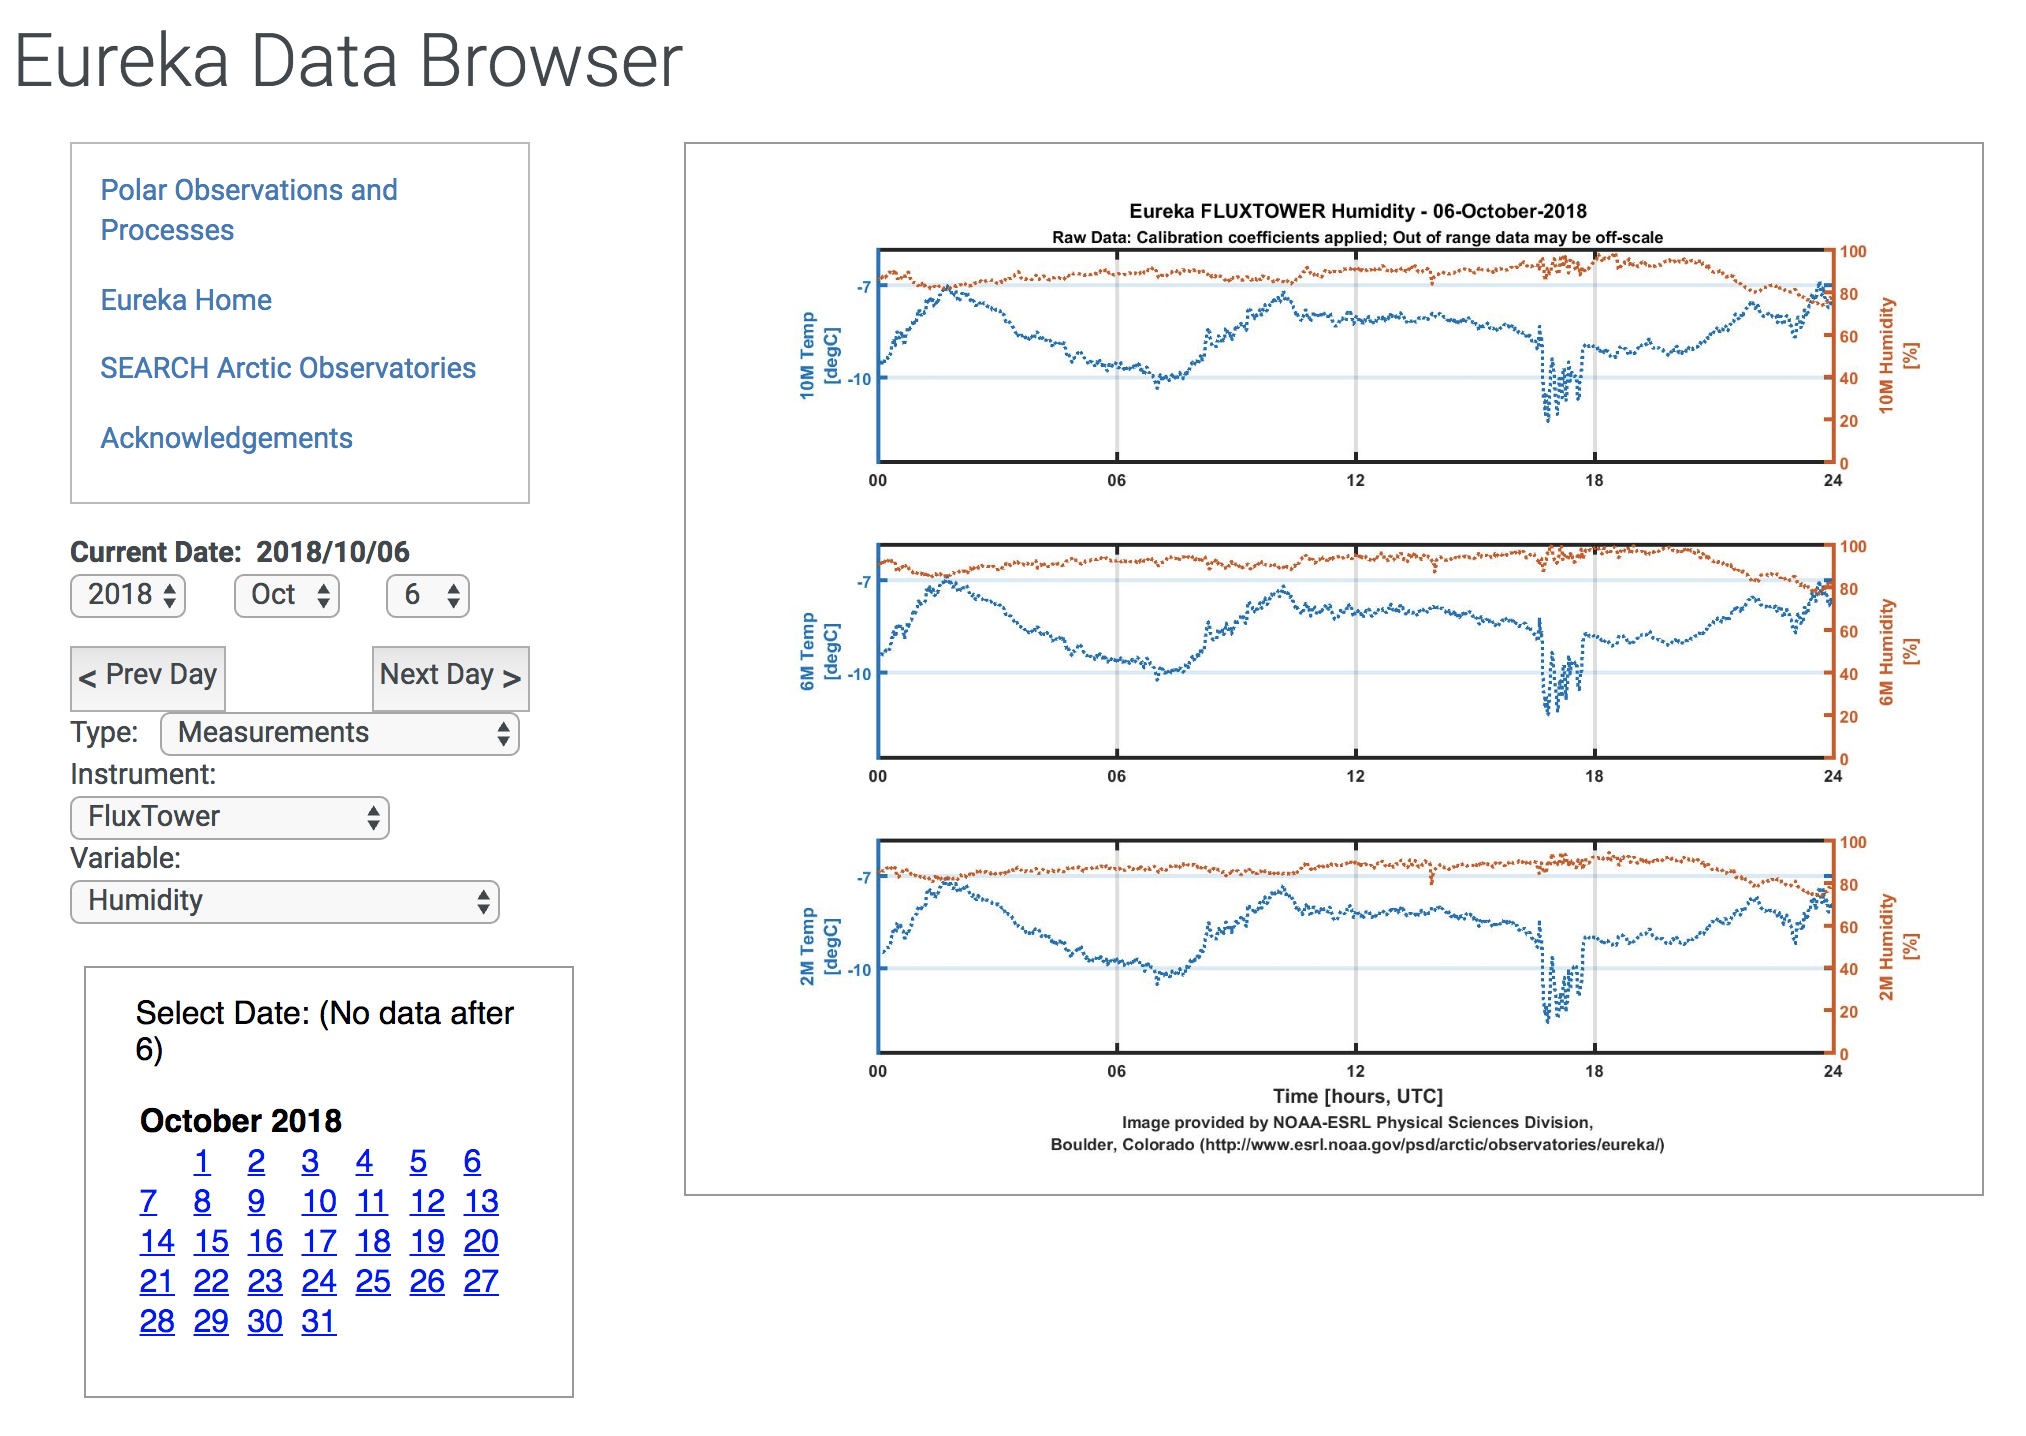
Instrument Data Displays
Arctic Datasets in Other ESRL Divisions
Global Monitoring Laboratory
Atmospheric Data from the IASOA Observatories
IASOA Observatories Include: Cherskii, Russia; Tiksi, Russia; Pallas, Finland; Ny-Aalesund, Svalbard; Villum, Greenland; Summit, Greenland; Alert, Canada; Eureka, Canada; Oliktok Point, Alaska; and Barrow, Alaska.
Take a look: IASOA Data At-A-Glance
Other Arctic Data and Dataset Plotting/Analysis Pages
- NOAA's Arctic Theme Page Data Links
- AVHRR Near Real-Time Polar Clouds and Radiation (University of Wisconsin Lidar Group)
- National Snow and Ice Data Center
- Current State of Cyrosphere
- Arctic Hydrology Data (GIS)
- Unaami Data Dollection (Get data and make plots)
- Advanced Cooperative Arctic Data and Information Service (ACADIS)
- Eureka 2010 Lidar Measurements Archive (Dalhousie University, Halifax, Canada)
- Arctic Regional Climate Model Intercomparison (ARCMIP)
- Arctic Analysis and current maps
- Arctic Weather forecast maps (Ohio University)
- POLARCAT (polar study using aircraft, remote sensing, surface measurements and models, of climate, chemistry, aerosols, and transport)