
Surface Ozone (O3), also called Troposheric Ozone, is a critical atmospheric species that drives much of tropospheric photochemistry. It regulates the oxidation capacity of the troposphere, influencing background levels of trace chemicals. Ozone is also a strong greenhouse gas, and is the third most important contributor to greenhouse radiative forcing behind CO2 and CH4.
Ozone is produced in the troposphere by photochemical oxidation of CO, CH4 and non-methane volatile organic carbons (NMVOCs) in the presence of NOx. Stratosphere-troposphere exchange is another source of ozone to the troposphere. Loss of tropospheric ozone takes place through chemical reactions and dry deposition. Ozone is a key trace gas for both the chemistry and radiative balance of the troposphere, and is the principal pollutant associated with photochemical smog.
The ESRL Global Monitoring Division has been measuring surface ozone at several global locations starting at Barrow, Alaska and Mauna Loa, Hawaii in 1973. The map and table below show the locations of surface ozone measurements.

Additional station information.
| Code | Name | Country | Latitude | Longitude | Elevation (Meters) | Start | End | Station Image | Data Plots |
|---|---|---|---|---|---|---|---|---|---|
| ARH | Arrival Heights, Antarctica | New Zealand | -77.833 | 166.200 | 250 | 1996 | Ongoing | ARH.jpg |
•Data Plots •Status Plots |
| BAO | Boulder Atmospheric Observatory, Colorado | United States | 40.050 | -105.004 | 1584 | 2008 | 2016 | BAO.jpg |
•Data Plots |
| BMW | Tudor Hill, Bermuda | United Kingdom | 32.270 | -64.880 | 30 | 1988 | Ongoing | BER.jpg | Data Plots |
| BOS | Table Mountain, Boulder, Colorado | United States | 40.1250 | -105.2368 | 1689 | 2016 | Ongoing | BOS.jpg |
•Status plots |
| BRW | Barrow, Alaska | United States | 71.323 | -156.611 | 11 | 1973 | Ongoing | BRW.jpg |
•Data Plots •Status plots |
| EUR | Eureka, Nunavut | Canada | 79.9830 | -85.9500 | 0 | 2003 | Ongoing | EUK.jpg |
•Status plots |
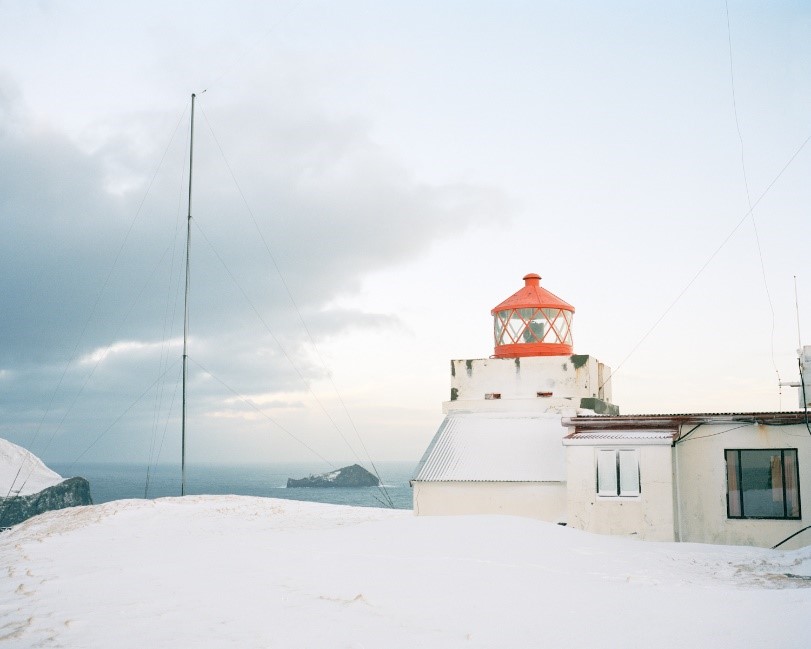
| ICE | Storhofdi, Vestmannaeyjar | Iceland | 63.400 | -20.288 | 118 | 2003 | 2010 | ICE.jpg | Data Plots |
| LAU | Lauder | New Zealand | -45.040 | 169.680 | 370 | 2003 | Ongoing | LAU.jpg |
•Data Plots •Status Plots |
| MBO | Mount Bachelor Observatory, Oregon | United States | 43.9775 | -121.6861 | 2731 |
•Status plots |
|||
| MLO | Mauna Loa, Hawaii | United States | 19.536 | -155.576 | 3397 | 1973 | Ongoing | MLO.jpg |
•Data Plots •Status Plots |
| NWR | Niwot Ridge, Colorado | United States | 40.0362 | -105.544 | 3035 | 1990 | Ongoing | NWR.jpg |
•Data Plots •Status plots from forest (C-1) site |
| PCO | Pico, Azores | Portugal | 38.470 | -28.400 | 2225 | 2011 | 2016 | PCO.jpg | Data Plots |
| RPB | Ragged Point | Barbados | 13.170 | -59.430 | 45 | 1989 | Ongoing | RPB.jpg | Data Plots |
| SFF | Walden, Colorado | United States | 40.664 | -106.362 | 2490 |
•Status plots |
|||
| SMO | Tutuila | American Samoa | -14.247 | -170.564 | 42 | 1975 | Ongoing | SMO.jpg |
•Data Plots |
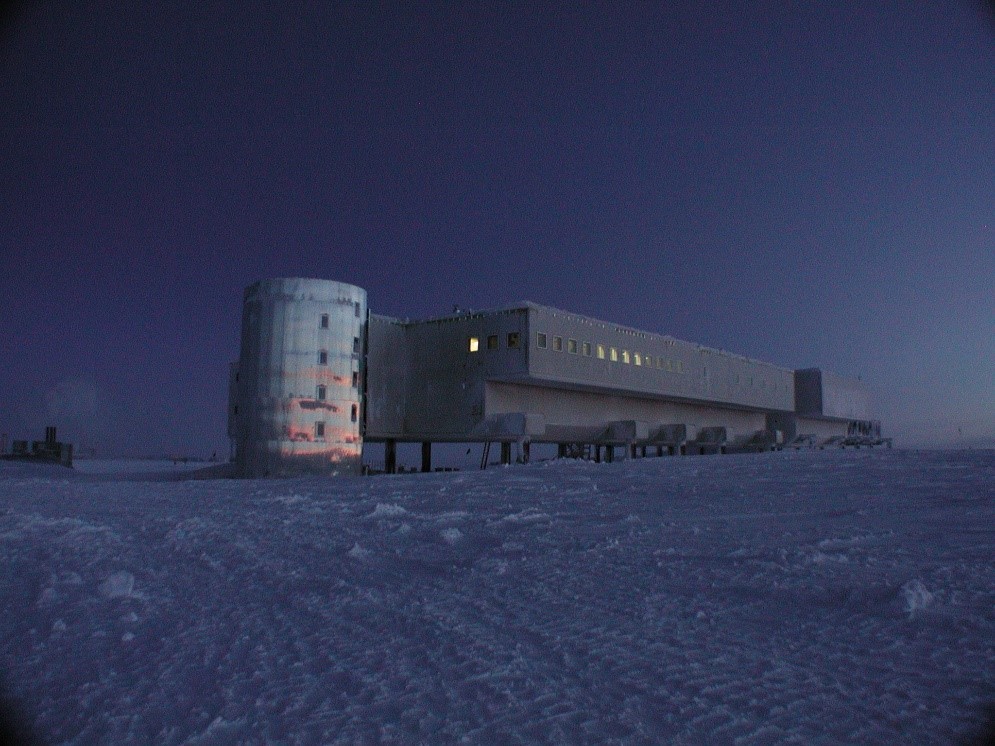
| SPO | South Pole, Antarctica | United States | -89.980 | -24.800 | 2810 | 1975 | Ongoing | SPO.jpg |
•Data Plots •Status Plots |
| SUM | Summit | Greenland | 72.580 | -38.480 | 3238 | 2000 | Ongoing | SUM.jpg |
•Data Plots •Status plots |
| THD | Trinidad Head, California | United States | 41.054 | -124.151 | 107 | 2001 | Ongoing | THD.jpg |
•Data Plots •Status plots |
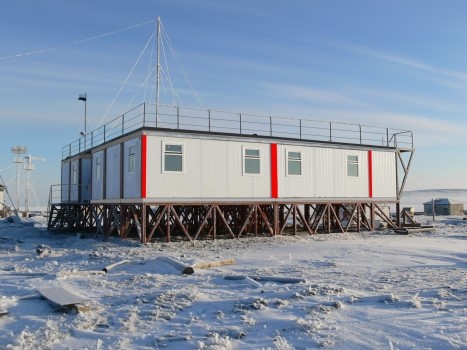
| TIK | Hydrometeorological Observatory of Tiksi | Russia | 71.597 | 128.889 | 31 | 2010 | Ongoing | TIK.jpg | Data Plots |
| TUN | Tundra Lab, Niwot Ridge, Colorado | United States | 40.0542 | -105.5889 | 3538 | 2003 | Ongoing | TUN.jpg |
•Status plots from tundra site |
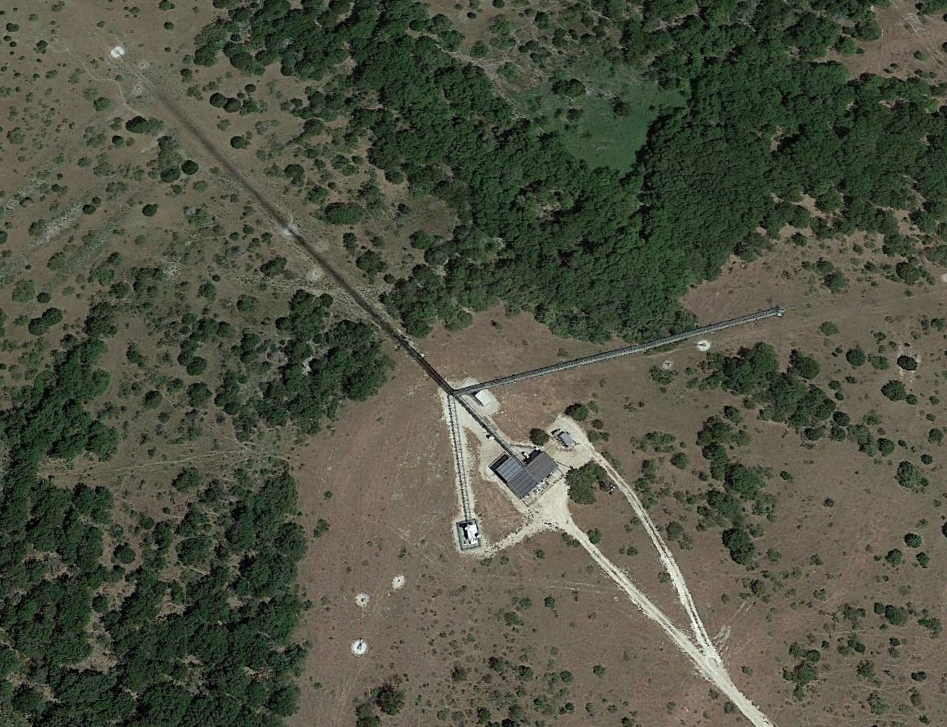
| WKT | Moody, Texas | United States | 31.315 | -97.327 | 251 | 2009 | 2014 | WKT.jpg | Data Plots |
| WVR | Weaverville, California | United States | 40.731 | -122.942 | 613 | 2011 | Ongoing | WVR.jpg |
•Data Plots |