
Routine Vertical Profiling
Since its inception in 1992, the NOAA/ESRL/GML Global Greenhouse Gas Reference Network’s Aircraft Program has been dedicated to collecting air samples in vertical profiles over North America. The Ozone and Water Vapor group began sampling with the aircraft program in 2004, and now many sites include an ozone analyzer (see Table). The program's mission is to capture seasonal and inter-annual changes in trace gas mixing ratios throughout the boundary layer and free troposphere (up to 10,000m). At present, most aircraft program flights collect 12 flask samples at different altitudes as well as continuous ozone, temperature, and relative humidity profiles. These flask samples are stored in glass flasks for later analysis of Carbon Dioxide (CO2), Carbon Monoxide (CO), Nitrous Oxide (N2O), Methane (CH4), Molecular Hydrogen (H2), and Sulfur Hexafluoride (SF6), as well as isotopes of CO2 and CH4, and multiple Halo- and Hydrocarbons.
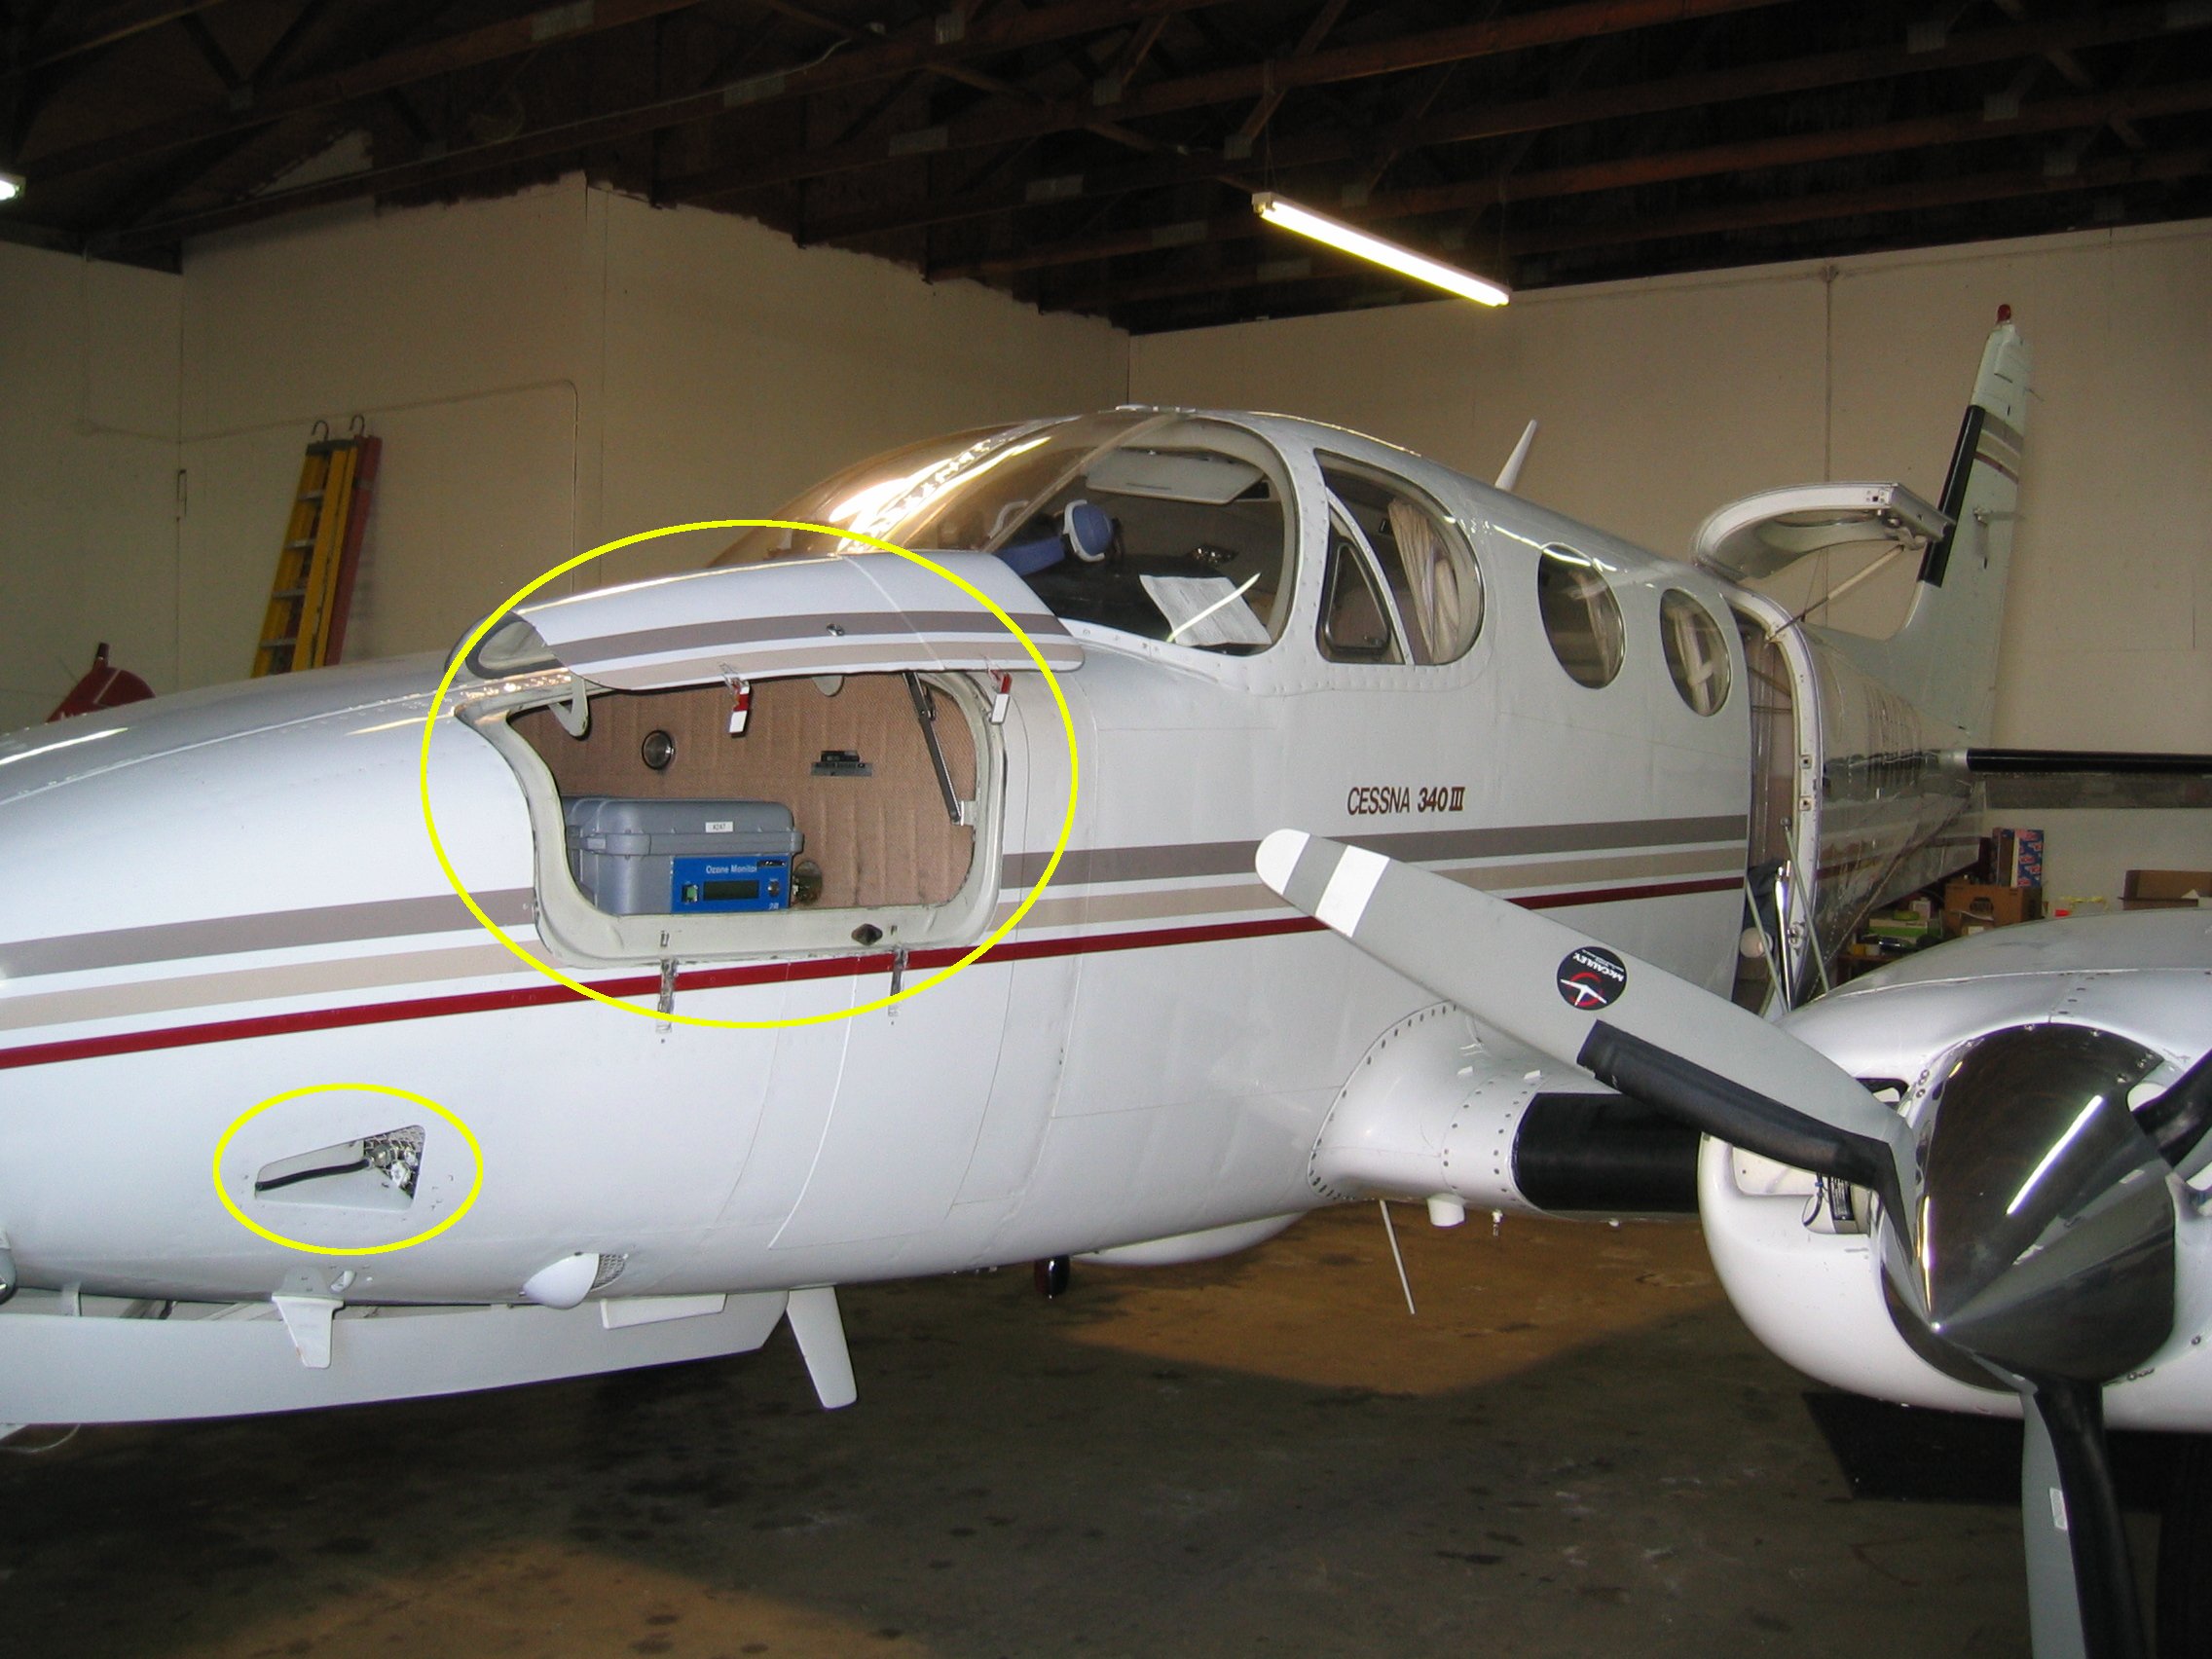
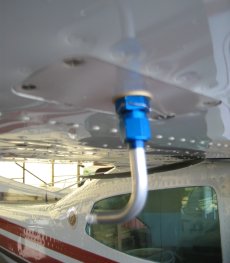
Vertical profiling at each site occurs at a frequency of 2-3x/week to 1x/month, dependent on the site. For each of these routine flights, the pilot loads equipment into a small aircraft, flies to the desired latitude and longitude (see Table 1) and then ascends to the desired altitude (typically 26,000 ft). The ozone and T/RH are being recorded at 10-second intervals, but in order to fill flask samples, the pilot descends to multiple altitude levels and circles for approximately two minutes to flush and fill each flask. The pilot then ships the flask samples back to NOAA/ESRL for analysis, while only the ozone, GPS coordinates, and T/RH data (rather than the instrument itself) is sent back. Our aircraft data sets contain ozone mixing ratios, GPS coordinates, and T/RH profiles. Data from the flask packages is located through the Interactive Data Viewer.
| Code | Name | Latitude | Longitude | Elevation (meters) | Date of Active Site* (month/year) | Country |
|---|---|---|---|---|---|---|
| AAO | Airborne Aerosol Observing, Bondville, Illinois | 40.05 | -88.37 | 230.0 | 1/2006-1/2010 | United States |
| BGI | Bradgate, Iowa | 42.82 | -94.41 | 355.1 | 6/2005-11/2005 | United States |
| BNE | Beaver Crossing, Nebraska | 40.80 | -97.18 | 465.9 | 1/2005-current | United States |
| CAR | Briggsdale, Colorado | 40.37 | -104.30 | 1740.0 | 3/2004-current | United States |
| CMA | Cape May, New Jersey | 38.83 | -74.32 | 0.0 | 8/2005-current | United States |
| ESP | Estevan Point, British Columbia | 49.58 | -126.37 | 7.0 | 3/2009-current | Canada |
| FWI | Fairchild, Wisconsin | 44.66 | -90.96 | 334.3 | 7/2005-11/2005 | United States |
| HIL | Homer, Illinois | 40.07 | -87.91 | 201.5 | 9/2005-current | United States |
| NHA | Worcester, Massachusetts | 42.95 | -70.63 | 0.0 | 5/2005-current | United States |
| OIL | Oglesby, Illinois | 41.28 | -88.94 | 192.6 | 9/2005-10/2005 | United States |
| SCA | Charleston, South Carolina | 32.77 | -79.55 | 0.0 | 10/2005-current | United States |
| SGP | Southern Great Plains, Oklahoma | 36.80 | -97.50 | 314.0 | 6/2006-current | United States |
| THD | Trinidad Head, California | 41.05 | -124.15 | 107.0 | 4/2005-current | United States |
| ULB | Ulaanbaatar | 47.40 | 106.00 | 1350.0 | 11/2004-10/2008 | Mongolia |
| WBI/RIA | West Branch, Iowa/Rowley, Iowa | 41.73/42.40 | -91.35/-91.84 | 241.7/298.7 | 1/2005-5/2011 | United States |
*Ozone measurement data is available during active site dates.