
Measurements at the Mauna Loa Observatory stopped after the 2022 eruption of the Mauna Loa volcano, when lava flow crossed the access road and took out power lines to the facility. The observatory remains inaccessible by vehicle and without power from the local utility company.
Observatory staff has established limited solar power in four observatory buildings and restored approximately 33 percent of the measurements onsite, including the Global Monitoring Laboratory and Scripps critical CO2 records and other atmospheric measurements.
Media can contact: Theo Stein (303) 819-7409 (theo.stein@noaa.gov) or Karin Vergoth 303-632-6413 (karin.vergoth@noaa.gov)
Carbon Dioxide (CO2) and related gases in the atmosphere are measured at MLO and Cape Kumukahi, Hawaii. Analysis of flask air samples at MLO and Cape Kumukahi include Carbon-13 (13C) and Nitrous Oxide (N2O) in addition to CO2.
(Where are MLO and Cape Kumukahi?)
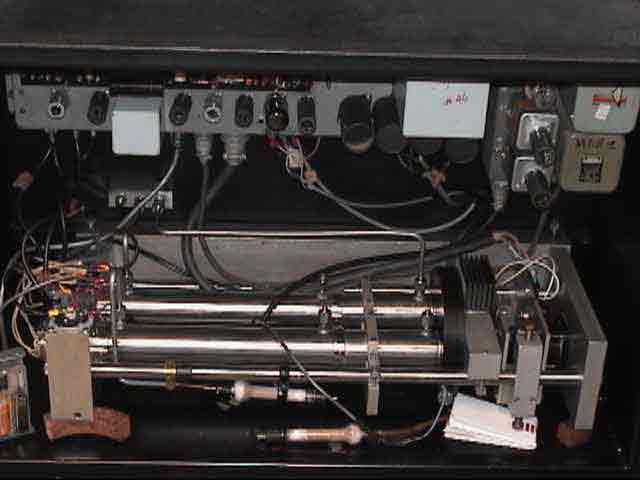
At MLO, continuous CO2 concentrations are recorded using a NDIR (nondispersive infrared) instrument with the air samples coming from three possible inlets. The inlet location is selected to minimize possible impacts of the MLO facility. Flask samples in 5-liter evacuated flasks are obtained on a weekly schedule at MLO and at Cape Kumukahi (sea level). Meteorological criteria are used to maximize the probability of sampling “clean” air in the flasks. SIO flask sampling programs are carried out in a similar manner at the other three CMDL observatories.
It provides long term monitoring of CO2 and related gases in the atmosphere at MLO and Cape Kumukahi.
The Mauna Loa atmospheric CO2 concentration measurements taken since 1958 constitute the longest, continuous record of atmospheric CO2 available in the world!
Below is a plot of the CO2 record from the Scripps program. Each point is the monthly mean of the continuous record at Mauna Loa. A smooth trend consisting of a seasonal cycle and a long-term trend is fitted to the data. The annual springtime drawdown in CO2 concentration is apparent in the seasonal cycle.
The record shows a 19.4% increase in the mean annual concentration, from 315.98 parts per million by volume (ppmv) of dry air in 1959 to 377.38 ppmv in 2004. Data prior to May 1974 are from the program initiated in 1958 by Charles D. Keeling, Scripps Insitution of Oceanography.
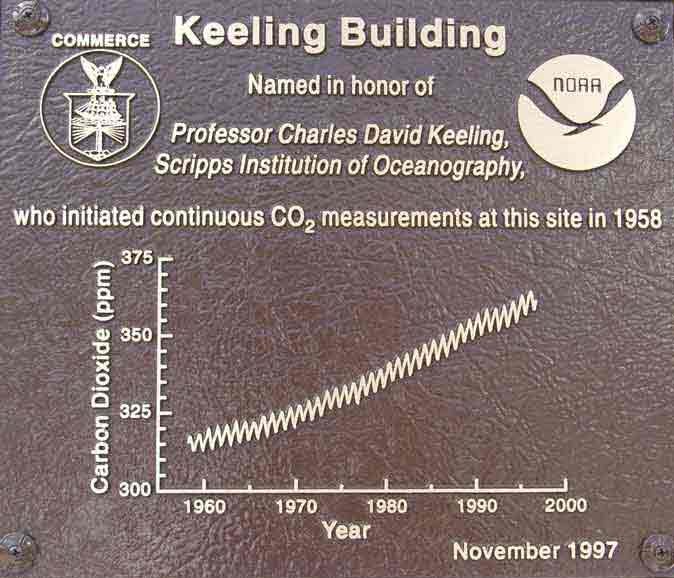
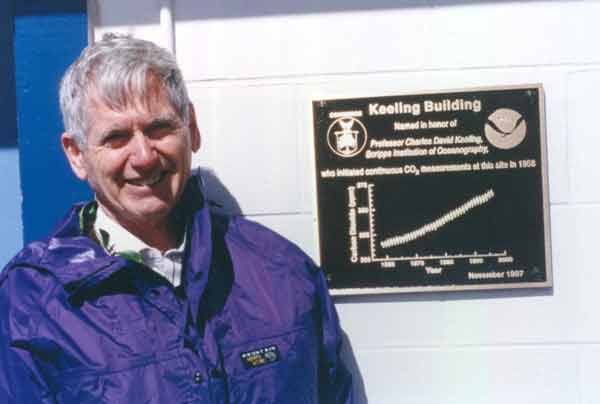
The plaque below marks the entrance to the Charles Keeling Building at Mauna Loa. The measurements related to this program are among the most highly regarded achievements in the history of Mauna Loa Observatory. Dr. Keeling was the first to report that global atmospheric concentrations of carbon dioxide are rising.
During the day, leaves from plants absorb sunlight to take up Carbon Dioxide (CO2) from the atmosphere in a process called photosynthesis. At the same time plants, animals and soil microbes consume the carbon in organic matter and return CO2 to the atmosphere during respiration. During winter in the northern hemisphere, photosynthesis ceases when many plants lose their leaves, but respiration continues. This condition leads to an increase in atmospheric CO2 concentrations during the northern hemisphere winter. With the onset of spring, however, photosyhtesis resumes and atmospheric CO2 concentrations are reduced. This cycle is reflected in this chart.
Much more information is available at the Scripps CO2 website:
http://scrippsco2.ucsd.edu/
Dr. Ralph Keeling
858-534-7582
Dave Moss
858-534-2780
Steve Ryan
808-933-6965 (x235)
Aidan Colton
808-933-6965 (x233)
http://scrippsco2.ucsd.edu/
http://www.esrl.noaa.gov/ccgg/trends/
January, 1958
Scripps Oxygen (O2)
Greenhouse Gases

