Introduction
Much work has been done to upgrade
the RITS (Radiatively Important Trace Species) dataset. Three-channel
RITS system chromatographs, all of which have
now been replaced by newer and more capable four-channel CATS
(Chromatograph for Atmospheric Trace Species) systems, were operational
over a period of 15 years from 1986 to 2001. RITS systems were installed
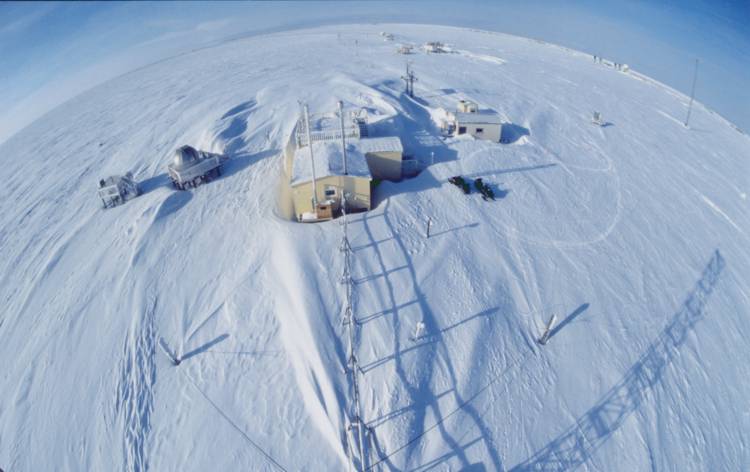
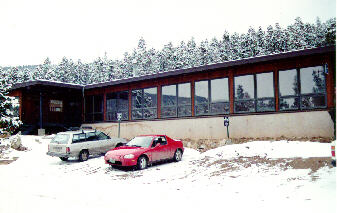
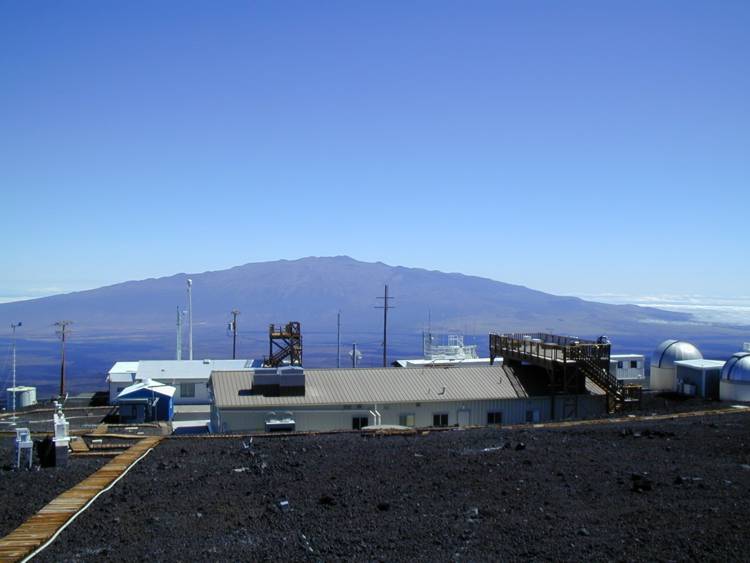
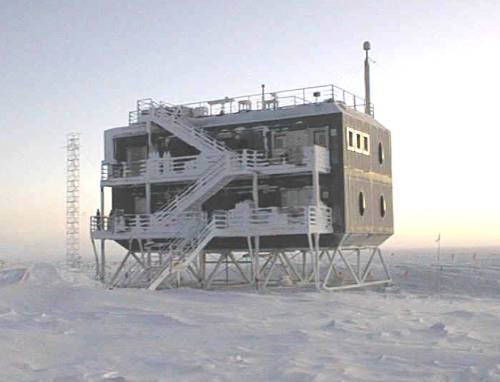
at four baseline observatories and a fifth site at Niwot Ridge, Colorado
(Table 1) to give measurements of N2O,
CFC-12, CFC-11, CFC-113, CH3CCl3, and
CCl4 with dual-channel redundancy for N2O and CFC-11. The top
sample injection rate at all five field sites was 1 injection every 30
minutes for a combined maximum analysis burden of ~13,000 chromatographic
peaks per week.
Especially during the early years of operation, RITS chromatography and
the hardware, software, and analysis procedures used to record and
manipulate the data evolved over time. Consequently, several file formats
were used for storing both the raw data (~2.5 million saved chromatograms)
and the database of chromatographic-peak analysis outputs (areas and
heights). Long term storage media for these data files included several
computer hard drives, 48 DC600 tape cartridges, 17 magneto optical disks,
and several hundred floppy disks.
It is also worth noting that early chromatogram analysis and quality
control measures were significantly constrained by limitations in
processing power. The labor requirements involved in simply keeping up
with the new data coming in and remotely troubleshooting the inevitable
equipment problems arising at the field sites limited the time available
for revisiting earlier data reductions. Accordingly, the computation of
atmospheric concentrations from the areas/heights measurements was largely
performed in a piecewise fashion on an annual basis.
The primary purpose of this upgrade effort, which was funded by a grant
from the Environmental Services Data and Information Management Program
(ESDIM), was to implement an enhanced
system of quality control procedures and graphical techniques in order to
re-examine the RITS data in its entirety while concurrently standardizing
the chromatogram files and the areas/heights database files to common
formats for renewed storage on CDROM. Particular emphasis was given to
identifying and recovering data inadvertently lost or degraded during the
original reduction.
The Raw Data
The initial phase of the upgrade effort involved the standardization
and inventory of the RITS raw data. Chromatograms
(examples) were converted to a common format
and exposed to a thorough series of consistency checks prior to storage
renewal on CDROM.
Chromatogram recording errors involving
the timestamp and/or source-label of the sample injection often occurred
for a variety of reasons. The format-standardizing program checked for
time folds -- regions of overlapping chromatograms due to an improper
system clock setting -- and other inconsistencies between the internal
(file header) and external (filename) descriptors. Sample-source labeling
errors were detected graphically by plotting ratios of processed peak
response measures for nearby environmental and calibration sample
injections. Cross-channel inconsistencies were detected by passing the
chromatograms through an inventory program that recorded the station,
timestamp, sample source, and channel of each chromatogram found within a
30- minute time slot. Inconsistencies were found in ~1 % of the
chromatograms processed. These were corrected and reanalyzed to recover
the data.
The Areas/Heights Database
The outputs generated during original chromatogram analyses were
assembled in record-oriented binary or text format database files for
later retrieval during the computation of atmospheric mixing ratios.
Each of the original database files was structured in accordance with
one of several multiple-injection sampling cycles. Data records were
designed to accommodate a full cycle of injections to which a single
timestamp was assigned. The details of the sampling cycle and the form
of the timestamp both changed over time.
Newly-developed graphical displays of the original database found
significant data degradation and loss that occurred during chromatogram
processing due to the limitations of the analysis software. Problems
included the misidentification of analysis peaks
(Figure 3), peaks that were missed
altogether because of an excessively-constrained analysis method
(Figure 4), and analytical instabilities
associated with an insufficiently-constrained analysis method
(Figure 5). These problems ultimately
resulted from the inability of the analysis software to focus all of its
limited resources on one peak at a time. This was addressed by modifying
the software to give it this ability and then reanalyzing the affected
peaks.
Another problem was discovered to be related to the coarse
time-resolution of the original database files. The grouping of an
entire sampling cycle into a single data record with a single timestamp
led to spurious timestamp modification and data loss by overwriting
after interruptions to the normal sampling cycle. This was addressed by
restructuring the areas/heights database to include timestamps for every
sample injection. This was accomplished by initializing the
restructured database with timestamps and sample source identifiers from
the chromatogram inventory and employing an algorithm that matched the
peak analysis outputs stored in the original database with the
corresponding initialized data records in the new database. Although
this problem was relatively minor, restructuring the database offered
several important additional advantages.
First, the restructured database is compatible with all structural
variants found among the original database files. Thus, all of the data
associated with a given analysis peak was able to be collected into a
single file without regard to the details of the sampling cycle.
Second, upon scanning the new database in search of overwritten
samples (i.e. initialized records not corresponding to any peak
analysis outputs in the original database) -- which typically numbered
on the order of a thousand per station -- tens of thousands more good
quality samples were discovered to have been overlooked during the
original reduction. All overwritten and overlooked chromatograms were
fetched and analyzed to fill in the gaps.
Finally, storage space was added to each data record to facilitate
the flagging (i.e. filtering) of individual injections for equipment
problems. Because a single calibration sample of poor quality can
adversely affect several individual calculations of a compound's
atmospheric mixing ratio, marking these samples prior to final reduction
is a powerful way to enhance the overall quality of the dataset. A
combination of graphical and statistical methods was used to scan the
entire restructured areas/heights database and flag well-known
chromatography problems (Figure 6).
Calibration Issues
RITS systems were calibrated using tertiary ("working")
gas standards
that were shipped to the field sites in stainless steel cylinders. The
working standards, or "caltanks", were filled with atmosphere in the
Colorado Rockies at or above 3000 meters of altitude. These gases were
referenced in the laboratory against calibration scales derived from a
series of gravimetrically-developed, primary gas standards.
Gravimetrically-developed calibration scales are periodically updated
each time a new gravimetric standard is developed, and each new scale
differs — often negligibly but sometimes significantly — from
its predecessors. For each of the RITS compounds, multiple gravimetric
scales were used to calibrate the many working standards shipped to
field sites over the 15-year history of measurements. The primary issue
remaining involves the need for decisions about how best to reconcile
instances when changing calibration scales or changing caltanks produced
significant shifts in the measured atmospheric signals of RITS compounds.
RITS systems typically alternated sampling from two separate
atmospheric-intake lines and two caltanks. Efforts were made to use
caltank pairs with gas concentration very close to that normally found
in relatively clean troposhperic air but with enough separation to give
a reasonably stable two-point local estimate of the resonse curve for
the ECD. The success of this approach is sensitively dependent upon the
relative response characteristics of the three independent sample
streams (i.e. the two calibration streams and the combined atmospheric
stream).
Figure 7 is a comparison of three linear
approximations to a hypothetical ECD response curve. In this idealized
example, the two-point CAL1 through CAL2 calibration is the most
accurate of the three shown. However, the accuracy of any of these
calibrations is sensitive to the closeness of the air concentration to
the calibration concentration(s) involved in the computation. Also, in
situations where the calibration concentrations are poorly separated,
the statistical noise in the calibration response measurements can lead
to chaotic fluctuations in the two-point linear approximation to the
response curve. The extent to which this problem will affect the
atmospheric concentration estimate increases rapidly with increasing
distance between the atmospheric concentration and both calibration
concentrations. The one-point calibrations through zero are
comparatively immune to this noise-amplifying interplay between the
normal statistical noise of the calibration response measurements and a
relatively small separation between calibration concentrations
(Figure 8).
For this reason, and also for those time periods when only one
available caltank was installed on a RITS system, we have sought
to improve upon the accuracy of the one-point calibration through the
usage of a statistically-developed approximation to the normalized
response curve for the ECD. The method looks at comparisons between the
calibration response ratio and the calibration concentration ratio over
the history of RITS measurements of a given compound at a given field
site. Links to materials that describe the calibration method in more
detail are provided below:
|