|
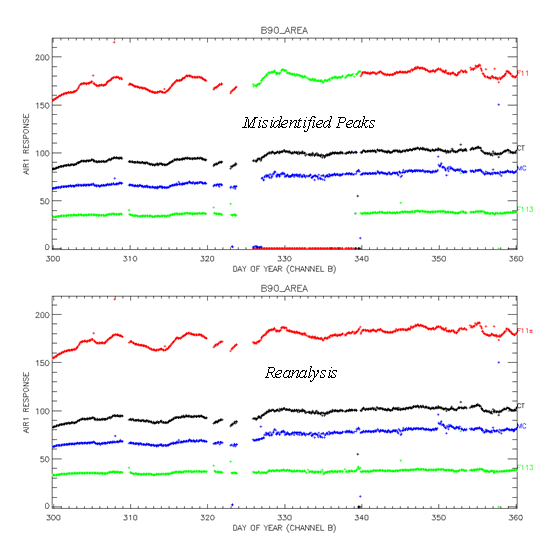
Figure 3. Time series plots of channel b chromatographic peak
areas for air samples injected at Barrow, Alaska from 10/27/90 to
12/26/90 (i.e. days 300 - 360 of the year 1990). CFC-11 (F11 in the
right-hand margin of each plot) is shown in red, CFC-113 (F113) in green,
CH3CCl3 (MC) in blue, and CCl4 (CT) in
black. From day 326 to day 339 CFC-11 was mistakenly identified as
CFC-113 (top frame). Concurrently, CFC-113 was completely missed (see
also Figure 4). A thorough visual scan of
the database using plots such as these revealed numerous episodes,
usually of lesser duration, where the peak analysis software committed
peak identification errors similar to that illustrated here. The
chromatograms (examples) were reanalyzed
to correct the problem (bottom frame).
|