|
Information
Results
Get Involved
Resources
|
|
|
|
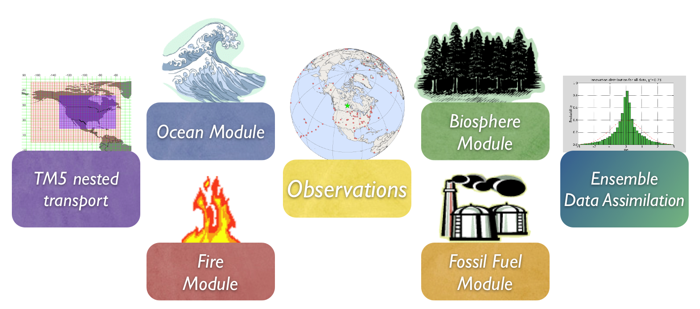
To learn more about a CarbonTracker component, click on one of the above images.
Or download the full PDF version for convenience.
|
|
1. Introduction
The observations of CO2 mole fraction by NOAA ESRL and partner laboratories are at the heart of CarbonTracker. They inform us on changes in the carbon cycle, whether they are regular (such as the seasonal growth and decay of leaves and trees), or irregular (such as the release of tons of carbon by a wildfire). The results in CarbonTracker depend directly on the quality, amount and location of observations available, and the degree of detail at which we can monitor the carbon cycle reliably increases strongly with the density of our observing network.
2. Detailed Description
This study uses measurements of air samples collected at surface sites in the NOAA ESRL Cooperative Global Air Sampling Network, the CSIRO Air Sampling Network and the IPEN-CQMA sampling program where available, except those flagged for analysis or sampling problems, or those thought to be influenced by local sources. The sites for which data are available thus varies each week depending on successful sampling and analysis, and each site's sampling frequency. In addition, we use in situ quasi-continuous CO2 time series from the following towers:
- the 107m level of the AMT tower in Argyle, Maine
- the 300m level of the BAO tower in Boulder, Colorado
- the 396m level of the LEF tower in Park Falls, Wisconsin
- the 305m level of the SCT tower in Beech Island, South Carolina
- the 17m level of the SNP tower in Shenandoah National Park, Virginia
- the 379m level of the WBI tower in West Branch, Iowa
- the 483m level of the WGC tower in Walnut Grove, California
- the 457m level of the WKT tower in Moody, Texas
- the 30m level of the tower at Candle Lake (CDL, formerly Old Black Spruce), Saskatchewan, Canada operated by Environment Canada (EC);
- the 105m level of the tower in East Trout Lake, Saskatchewan, Canada (ETL) operated by EC
- the 40m level of the tower in Fraserdale, Ontario, Canada (FRD) operated by EC
- the 10m level of the tower in Lac Labiche, Alberta, Canada (LLB) operated by EC
- the 60m level of the tower at the Atmospheric Radiation and Monitoring (ARM) Carbon Project Southern Great Plains, Oklahoma site (SGP) operated by Lawrence Berkeley National Laboratory (LBNL).

Other in situ quasi-continuous CO2 time series used are from the NOAA ESRL observatories at Barrow (BRW), Mauna Loa (MLO), Samoa (SMO), and South Pole (SPO); the EC Canadian sites at Alert, Nunavut (ALT), Sable Island, Nova Scotia (SBL) and Egbert, Ontario (EGB); and the NCAR sites at Niwot Ridge, Colorado (NWR) and Storm Peak Laboratory, Colorado (SPL). Note that all of these observations are calibrated against the same world CO2 standard (WMO-X2007). Also, note that aircraft observations from the NOAA ESRL program were NOT assimilated, but used for independent assessment of the CarbonTracker results.
For most of the quasi-continuous sampling sites, we construct an afternoon daytime average mole fraction for each day from the time series, recognizing that our atmospheric transport model does not always capture the continental nighttime stability regime while daytime well-mixed conditions are better matched. At mountain-top sites (MLO, NWR, and SPL), we use an average of nighttime hours as this tends to be the most stable time period and avoids periods of upslope flows that contain local vegetative and/or anthropogenic influence. Moreover, observations at sub-daily time scales are likely to be strongly correlated and therefore add relatively little independent information to our results.
Data from the Sutro tower (STR_01P0) and the Boulder tower (BAO_01P0, BAO_01C3) are strongly influenced by local urban emissions, which CarbonTracker is unable to resolve. At these two sites, pollution events have been identified using co-located measurements of carbon monoxide. In this study, measurements thought to be affected by pollution events have been excluded. This technique is still being developed.
Also based on Transcom continuous simulations, we decided to move a set of coastal sites by one degree into the ocean to force the model sample to be more representative of the actual site conditions. These sites are labeled for reference in the complete table of sites used in CarbonTracker. Table 1 summarizes how data from the different measurement programs are preprocessed for this study.
The preprocessed data used in CarbonTracker are freely available for download. Preprocessed data are not the original measurement data. Users are encouraged to review the literature and contact the measurement labs directly for details about and access to the actual observations.

Table 1: Summary of CarbonTracker data preprocessing.
Measurement Program | Data Preprocessing
| | ESRL discrete surface | All valid1 data. Multiple values from the same day and location are averaged. No sample time-of-day restriction (see exception below). |
| ESRL discrete tower | All valid1 data. Multiple values from the same day and location are averaged. Only samples collected between 12-16 LST are considered. |
| ESRL observatories (BRW, SMO, SPO) | All valid1 data. Day average using 12-16 LST. |
| ESRL observatories (MLO) | All valid1 data. Day average using 0-4 LST. |
| ESRL tower sites | All valid data from highest intake. Day average using 12-16 LST. |
| EC in situ sites | All valid data from highest intake. Day average using 12-16 LST. |
| NCAR in situ sites | All valid data from highest intake where 1σ of hourly average < 1 ppm. Day average using 0-4 LST. |
| CSIRO discrete surface | All valid1 data. Multiple values from the same day and location are averaged. No sample time-of-day restriction. |
| IPEN discrete surface | All valid1 data. Multiple values from the same day and location are averaged. No sample time-of-day restriction. |
| LBNL in situ site | All valid data for the period 2003-2010. Day average using 14-18 LST. |
1In this context "Valid Data" means the observation is thought to be free of sampling and analytical problems and has not been locally influenced.
We apply a further selection criterion during the assimilation to exclude non-marine boundary layer (MBL) observations that are very poorly forecasted in our framework. We use the so-called model-data mismatch in this process, which is the random error ascribed to each observation to account for measurement errors as well as modeling errors of that observation. We interpret an observed-minus-forecasted (OmF) mole fraction that exceeds 3 times the prescribed model-data mismatch as an indicator that our modeling framework fails. This can happen for instance when an air sample is representative of local exchange not captured well by our 1° x 1° fluxes, when local meteorological conditions are not captured by our offline transport fields, but also when large-scale CO2 exchange is suddenly changed (e.g. fires, pests, droughts) to an extent that can not be accommodated by our flux modules. This last situation would imply an important change in the carbon cycle and has to be recognized by the researchers when analyzing the results. In accordance with the 3-sigma rejection criterion, ~2% of the observations are discarded through this mechanism in our assimilations.
Table 2 (below) gives a summary of the observing sites used in
CarbonTracker, and the performace of the assimilation scheme at each
site. These diagnostics are useful for evaluating how well
CarbonTracker does in simulating observed CO2.
Table 2. Summary of Observational Sites Used in CarbonTracker. Model-data-mismatch ("r") is a value assigned to a given site that is meant to quantify our expected ability to simulate observations there. This value is principally determined from the limitations of the atmospheric transport model. It is part of the standard deviation used to interpret the difference between a simulation first guess ("Hx") of an observation and the actual measured value ("z"). The other component, HPHT, is a measure of the ability of the ensemble Kalman filter to improve its simulated value for this observation by adjusting fluxes. These elements together form the innovation χ statistic for the site: χ = (z-Hx)/√(HPHT+r2). The innovation χ2 reported above is the mean of all squared χ values for a given site. An average χ2 below 1.0 indicates that the √(HPHT+r2) values are too large. Conversely, values above 1.0 mean that this standard deviation is underestimated. The bias and SE columns are statistics of the posterior residuals (final modeled values - measured values). The bias is the mean of these residuals; the SE is the standard error of those residuals.
| Site code | Lab. | Location | Latitude | Longitude | Elev. (m ASL) | No. Obs. Avail. | No. Obs. Used | No. Obs. Rej. | r (μmol mol-1) | Innov. χ2 | Bias (μmol mol-1) | SE (μmol mol-1) |
| ABP_01D0 | ESRL | Arembepe, Bahia, Brazil | 12.77°S | 38.17°W | 1 | 102 | 102 | 0 | 2.50 | 0.06 | -0.50 | 0.53 |
| ABP_26D0 | IPEN | Arembepe, Bahia, Brazil | 12.77°S | 38.17°W | 1 | 101 | 101 | 0 | 2.50 | 0.11 | -0.63 | 0.68 |
| ALT_01D0 | ESRL | Alert, Nunavut, Canada | 82.45°N | 62.51°W | 200 | 530 | 530 | 0 | 1.50 | 0.53 | 0.29 | 0.90 |
| ALT_06C0_14LST | EC | Alert, Nunavut, Canada | 82.45°N | 62.51°W | 200 | 3652 | 3652 | 0 | 2.50 | 0.23 | 0.29 | 0.99 |
| AMT_01C3_14LST | ESRL | Argyle, Maine, United States | 45.03°N | 68.68°W | 50 | 2272 | 2218 | 54 | 3.00 | 0.93 | 0.55 | 3.22 |
| AMT_01P0 | ESRL | Argyle, Maine, United States | 45.03°N | 68.68°W | 50 | 325 | 310 | 15 | 3.00 | 1.23 | 0.85 | 3.52 |
| ASC_01D0 | ESRL | Ascension Island, United Kingdom | 7.97°S | 14.40°W | 74 | 915 | 915 | 0 | 0.75 | 0.82 | -0.01 | 0.58 |
| ASK_01D0 | ESRL | Assekrem, Algeria | 23.18°N | 5.42°E | 2728 | 480 | 480 | 0 | 1.50 | 0.34 | 0.13 | 0.92 |
| AZR_01D0 | ESRL | Terceira Island, Azores, Portugal | 38.77°N | 27.38°W | 40 | 333 | 329 | 4 | 1.50 | 1.11 | 0.62 | 1.46 |
| BAL_01D0 | ESRL | Baltic Sea, Poland | 55.35°N | 17.22°E | 3 | 929 | 929 | 0 | 7.50 | 0.26 | -1.09 | 3.90 |
| BAO_01C3_14LST | ESRL | Boulder Atmospheric Observatory, Colorado, United States | 40.05°N | 105.00°W | 1584 | 964 | 952 | 12 | 3.00 | 1.00 | -0.98 | 2.70 |
| Site code | Lab. | Location | Latitude | Longitude | Elev. (m ASL) | No. Obs. Avail. | No. Obs. Used | No. Obs. Rej. | r (μmol mol-1) | Innov. χ2 | Bias (μmol mol-1) | SE (μmol mol-1) |
| BAO_01P0 | ESRL | Boulder Atmospheric Observatory, Colorado, United States | 40.05°N | 105.00°W | 1584 | 720 | 694 | 26 | 3.00 | 1.36 | -0.97 | 3.42 |
| BHD_01D0 | ESRL | Baring Head Station, New Zealand | 41.41°S | 174.87°E | 85 | 142 | 142 | 0 | 1.50 | 0.28 | 0.20 | 0.74 |
| BKT_01D0 | ESRL | Bukit Kototabang, Indonesia | 0.20°S | 100.32°E | 864 | 247 | 247 | 0 | 7.50 | 0.63 | 4.55 | 3.62 |
| BME_01D0 | ESRL | St. Davids Head, Bermuda, United Kingdom | 32.37°N | 64.65°W | 30 | 236 | 225 | 11 | 1.50 | 1.57 | 0.69 | 1.83 |
| BMW_01D0 | ESRL | Tudor Hill, Bermuda, United Kingdom | 32.27°N | 64.88°W | 30 | 347 | 344 | 3 | 1.50 | 0.87 | 0.59 | 1.28 |
| BRW_01C0_14LST | ESRL | Barrow, Alaska, United States | 71.32°N | 156.61°W | 11 | 2975 | 2973 | 2 | 2.50 | 0.23 | 0.07 | 1.04 |
| BRW_01D0 | ESRL | Barrow, Alaska, United States | 71.32°N | 156.61°W | 11 | 499 | 497 | 2 | 1.50 | 0.55 | -0.01 | 1.05 |
| BSC_01D0 | ESRL | Black Sea, Constanta, Romania | 44.17°N | 28.68°E | 3 | 399 | 386 | 13 | 7.50 | 1.18 | -5.28 | 7.32 |
| CBA_01D0 | ESRL | Cold Bay, Alaska, United States | 55.21°N | 162.72°W | 21 | 736 | 702 | 34 | 1.50 | 1.59 | -0.15 | 1.83 |
| CDL_06C0_14LST | EC | Candle Lake, Saskatchewan, Canada | 53.99°N | 105.12°W | 600 | 2509 | 2494 | 15 | 3.00 | 0.59 | 0.24 | 2.15 |
| CFA_02D0 | CSIRO | Cape Ferguson, Queensland, Australia | 19.28°S | 147.06°E | 2 | 205 | 205 | 0 | 2.50 | 0.24 | -0.44 | 1.09 |
| Site code | Lab. | Location | Latitude | Longitude | Elev. (m ASL) | No. Obs. Avail. | No. Obs. Used | No. Obs. Rej. | r (μmol mol-1) | Innov. χ2 | Bias (μmol mol-1) | SE (μmol mol-1) |
| CGO_01D0 | ESRL | Cape Grim, Tasmania, Australia | 40.68°S | 144.69°E | 94 | 404 | 404 | 0 | 0.75 | 0.16 | 0.07 | 0.28 |
| CGO_02D0 | CSIRO | Cape Grim, Tasmania, Australia | 40.68°S | 144.69°E | 94 | 404 | 404 | 0 | 0.75 | 0.16 | 0.03 | 0.27 |
| CHR_01D0 | ESRL | Christmas Island, Republic of Kiribati | 1.70°N | 157.17°W | 3 | 419 | 419 | 0 | 0.75 | 0.65 | -0.38 | 0.47 |
| CRZ_01D0 | ESRL | Crozet Island, France | 46.45°S | 51.85°E | 120 | 402 | 402 | 0 | 0.75 | 0.19 | 0.01 | 0.27 |
| CYA_02D0 | CSIRO | Casey, Antarctica, Australia | 66.28°S | 110.52°E | 51 | 200 | 200 | 0 | 0.75 | 0.30 | -0.21 | 0.27 |
| EGB_06C0_14LST | EC | Egbert, Ontario, Canada | 44.23°N | 79.78°W | 251 | 1959 | 1845 | 114 | 3.00 | 1.80 | 0.29 | 4.30 |
| EIC_01D0 | ESRL | Easter Island, Chile | 27.15°S | 109.45°W | 50 | 288 | 288 | 0 | 7.50 | 0.03 | 0.87 | 0.93 |
| ETL_06C0_14LST | EC | East Trout Lake, Saskatchewan, Canada | 54.35°N | 104.98°W | 492 | 1865 | 1857 | 8 | 3.00 | 0.57 | 0.13 | 2.01 |
| FSD_06C0_14LST | EC | Fraserdale, Canada | 49.88°N | 81.57°W | 210 | 3605 | 3579 | 26 | 3.00 | 0.56 | 0.19 | 2.57 |
| GMI_01D0 | ESRL | Mariana Islands, Guam | 13.43°N | 144.78°E | 3 | 723 | 723 | 0 | 1.50 | 0.37 | -0.03 | 0.90 |
| HBA_01D0 | ESRL | Halley Station, Antarctica, United Kingdom | 75.58°S | 26.50°W | 30 | 486 | 486 | 0 | 0.75 | 0.15 | -0.02 | 0.20 |
| Site code | Lab. | Location | Latitude | Longitude | Elev. (m ASL) | No. Obs. Avail. | No. Obs. Used | No. Obs. Rej. | r (μmol mol-1) | Innov. χ2 | Bias (μmol mol-1) | SE (μmol mol-1) |
| HPB_01D0 | ESRL | Hohenpeissenberg, Germany | 47.80°N | 11.01°E | 985 | 210 | 206 | 4 | 7.50 | 0.74 | 2.70 | 5.83 |
| HUN_01D0 | ESRL | Hegyhatsal, Hungary | 46.95°N | 16.65°E | 248 | 510 | 509 | 1 | 7.50 | 0.35 | -0.12 | 4.37 |
| ICE_01D0 | ESRL | Storhofdi, Vestmannaeyjar, Iceland | 63.40°N | 20.29°W | 118 | 486 | 482 | 4 | 1.50 | 0.55 | -0.02 | 1.07 |
| KEY_01D0 | ESRL | Key Biscayne, Florida, United States | 25.67°N | 80.16°W | 3 | 347 | 346 | 1 | 2.50 | 0.26 | 0.20 | 1.40 |
| KUM_01D0 | ESRL | Cape Kumukahi, Hawaii, United States | 19.52°N | 154.82°W | 3 | 638 | 638 | 0 | 1.50 | 0.34 | -0.02 | 0.95 |
| KZD_01D0 | ESRL | Sary Taukum, Kazakhstan | 44.06°N | 76.82°E | 601 | 441 | 438 | 3 | 2.50 | 0.63 | 0.49 | 3.21 |
| KZM_01D0 | ESRL | Plateau Assy, Kazakhstan | 43.25°N | 77.88°E | 2519 | 393 | 388 | 5 | 2.50 | 0.94 | 0.55 | 2.28 |
| LEF_01C3_14LST | ESRL | Park Falls, Wisconsin, United States | 45.95°N | 90.27°W | 472 | 3489 | 3412 | 77 | 3.00 | 0.87 | 0.25 | 2.85 |
| LEF_01P0 | ESRL | Park Falls, Wisconsin, United States | 45.95°N | 90.27°W | 472 | 1350 | 1296 | 54 | 3.00 | 1.28 | 0.39 | 3.29 |
| LLB_06C0_14LST | EC | Lac La Biche, Alberta, Canada | 54.95°N | 112.45°W | 540 | 1225 | 1172 | 53 | 3.00 | 1.66 | 0.19 | 3.76 |
| LMP_01D0 | ESRL | Lampedusa, Italy | 35.52°N | 12.62°E | 45 | 200 | 193 | 7 | 1.50 | 1.38 | 0.64 | 1.45 |
| Site code | Lab. | Location | Latitude | Longitude | Elev. (m ASL) | No. Obs. Avail. | No. Obs. Used | No. Obs. Rej. | r (μmol mol-1) | Innov. χ2 | Bias (μmol mol-1) | SE (μmol mol-1) |
| MAA_02D0 | CSIRO | Mawson Station, Antarctica, Australia | 67.62°S | 62.87°E | 32 | 206 | 206 | 0 | 0.75 | 0.26 | -0.17 | 0.26 |
| MHD_01D0 | ESRL | Mace Head, County Galway, Ireland | 53.33°N | 9.90°W | 5 | 407 | 407 | 0 | 2.50 | 0.18 | 0.09 | 1.06 |
| MID_01D0 | ESRL | Sand Island, Midway, United States | 28.21°N | 177.38°W | 4 | 497 | 496 | 1 | 1.50 | 0.61 | 0.52 | 1.12 |
| MKN_01D0 | ESRL | Mt. Kenya, Kenya | 0.05°S | 37.30°E | 3897 | 134 | 134 | 0 | 2.50 | 1.12 | 1.85 | 1.89 |
| MLO_01C0_02LST | ESRL | Mauna Loa, Hawaii, United States | 19.54°N | 155.58°W | 3397 | 3342 | 3342 | 0 | 0.75 | 0.76 | 0.18 | 0.63 |
| MLO_01D0 | ESRL | Mauna Loa, Hawaii, United States | 19.54°N | 155.58°W | 3397 | 566 | 566 | 0 | 1.50 | 0.22 | 0.13 | 0.68 |
| MQA_02D0 | CSIRO | Macquarie Island, Australia | 54.48°S | 158.97°E | 12 | 265 | 265 | 0 | 0.75 | 0.28 | 0.05 | 0.33 |
| NMB_01D0 | ESRL | Gobabeb, Namibia | 23.58°S | 15.03°E | 456 | 161 | 161 | 0 | 2.50 | 0.14 | 0.04 | 0.91 |
| NWR_01D0 | ESRL | Niwot Ridge, Colorado, United States | 40.05°N | 105.58°W | 3523 | 495 | 491 | 4 | 1.50 | 0.66 | 0.40 | 1.38 |
| NWR_03C0_02LST | NCAR | Niwot Ridge, Colorado, United States | 40.05°N | 105.58°W | 3523 | 1550 | 1549 | 1 | 3.00 | 0.25 | -0.36 | 1.32 |
| OBN_01D0 | ESRL | Obninsk, Russia | 55.11°N | 36.60°E | 183 | 155 | 151 | 4 | 7.50 | 0.97 | -1.16 | 8.26 |
| Site code | Lab. | Location | Latitude | Longitude | Elev. (m ASL) | No. Obs. Avail. | No. Obs. Used | No. Obs. Rej. | r (μmol mol-1) | Innov. χ2 | Bias (μmol mol-1) | SE (μmol mol-1) |
| OXK_01D0 | ESRL | Ochsenkopf, Germany | 50.03°N | 11.80°E | 1022 | 163 | 148 | 15 | 2.50 | 2.09 | -0.31 | 3.62 |
| PAL_01D0 | ESRL | Pallas-Sammaltunturi, GAW Station, Finland | 67.97°N | 24.12°E | 560 | 373 | 372 | 1 | 2.50 | 0.56 | -0.12 | 1.89 |
| POC_01D1 | ESRL | Pacific Ocean, N/A | 0.39°S | 132.32°W | 10 | 2043 | 2042 | 1 | 0.75 | 0.78 | -0.01 | 0.63 |
| PSA_01D0 | ESRL | Palmer Station, Antarctica, United States | 64.92°S | 64.00°W | 10 | 529 | 529 | 0 | 0.75 | 0.26 | -0.09 | 0.27 |
| PTA_01D0 | ESRL | Point Arena, California, United States | 38.95°N | 123.74°W | 17 | 381 | 381 | 0 | 7.50 | 0.43 | -2.75 | 4.06 |
| RPB_01D0 | ESRL | Ragged Point, Barbados | 13.17°N | 59.43°W | 45 | 499 | 499 | 0 | 1.50 | 0.47 | 0.21 | 1.09 |
| SCT_01C3_14LST | ESRL | Beech Island, South Carolina, United States | 33.41°N | 81.83°W | 115 | 675 | 667 | 8 | 3.00 | 1.00 | 0.08 | 2.94 |
| SEY_01D0 | ESRL | Mahe Island, Seychelles | 4.67°S | 55.17°E | 3 | 481 | 481 | 0 | 0.75 | 1.07 | 0.06 | 0.72 |
| SGP_01D0 | ESRL | Southern Great Plains, Oklahoma, United States | 36.80°N | 97.50°W | 314 | 407 | 388 | 19 | 2.50 | 1.42 | -0.54 | 3.06 |
| SGP_64C3_16LST | LBNL | Southern Great Plains, Oklahoma, United States | 36.80°N | 97.50°W | 314 | 2625 | 2565 | 60 | 3.00 | 1.08 | 0.07 | 3.23 |
| SHM_01D0 | ESRL | Shemya Island, Alaska, United States | 52.72°N | 174.10°E | 40 | 383 | 383 | 0 | 2.50 | 0.72 | -0.03 | 2.01 |
| Site code | Lab. | Location | Latitude | Longitude | Elev. (m ASL) | No. Obs. Avail. | No. Obs. Used | No. Obs. Rej. | r (μmol mol-1) | Innov. χ2 | Bias (μmol mol-1) | SE (μmol mol-1) |
| SIS_02D0 | CSIRO | Shetland Islands, Scotland | 60.17°N | 1.17°W | 30 | 88 | 88 | 0 | 2.50 | 0.41 | 0.74 | 1.31 |
| SMO_01C0_14LST | ESRL | Tutuila, American Samoa | 14.25°S | 170.56°W | 42 | 3446 | 3446 | 0 | 0.75 | 0.49 | 0.16 | 0.50 |
| SMO_01D0 | ESRL | Tutuila, American Samoa | 14.25°S | 170.56°W | 42 | 559 | 559 | 0 | 1.50 | 0.12 | 0.10 | 0.52 |
| SNP_01C3_02LST | ESRL | Shenandoah National Park, United States | 38.62°N | 78.35°W | 1008 | 716 | 696 | 20 | 3.00 | 1.13 | -0.40 | 3.14 |
| SPL_03C0_02LST | NCAR | Storm Peak Laboratory (Desert Research Institute), United States | 40.45°N | 106.73°W | 3210 | 1543 | 1540 | 3 | 3.00 | 0.44 | -0.52 | 1.75 |
| SPO_01C0_14LST | ESRL | South Pole, Antarctica, United States | 89.98°S | 24.80°W | 2810 | 3882 | 3882 | 0 | 0.75 | 0.09 | 0.03 | 0.19 |
| SPO_01D0 | ESRL | South Pole, Antarctica, United States | 89.98°S | 24.80°W | 2810 | 533 | 533 | 0 | 1.50 | 0.02 | 0.09 | 0.20 |
| STM_01D0 | ESRL | Ocean Station M, Norway | 66.00°N | 2.00°E | 0 | 850 | 847 | 3 | 1.50 | 0.55 | 0.18 | 1.06 |
| STR_01P0 | ESRL | Sutro Tower, San Francisco, California, United States | 37.76°N | 122.45°W | 254 | 642 | 632 | 10 | 3.00 | 0.64 | 0.08 | 2.55 |
| SUM_01D0 | ESRL | Summit, Greenland | 72.58°N | 38.48°W | 3238 | 430 | 430 | 0 | 1.50 | 0.43 | 0.32 | 0.90 |
| SYO_01D0 | ESRL | Syowa Station, Antarctica, Japan | 69.00°S | 39.58°E | 11 | 255 | 255 | 0 | 0.75 | 0.22 | -0.14 | 0.24 |
| Site code | Lab. | Location | Latitude | Longitude | Elev. (m ASL) | No. Obs. Avail. | No. Obs. Used | No. Obs. Rej. | r (μmol mol-1) | Innov. χ2 | Bias (μmol mol-1) | SE (μmol mol-1) |
| TAP_01D0 | ESRL | Tae-ahn Peninsula, Republic of Korea | 36.73°N | 126.13°E | 20 | 383 | 383 | 0 | 7.50 | 0.40 | 0.60 | 4.33 |
| TDF_01D0 | ESRL | Tierra Del Fuego, Ushuaia, Argentina | 54.87°S | 68.48°W | 20 | 192 | 192 | 0 | 0.75 | 0.44 | -0.19 | 0.40 |
| THD_01D0 | ESRL | Trinidad Head, California, United States | 41.05°N | 124.15°W | 107 | 369 | 324 | 45 | 2.50 | 3.25 | -2.39 | 3.83 |
| UTA_01D0 | ESRL | Wendover, Utah, United States | 39.90°N | 113.72°W | 1320 | 472 | 471 | 1 | 2.50 | 0.39 | 0.45 | 1.82 |
| UUM_01D0 | ESRL | Ulaan Uul, Mongolia | 44.45°N | 111.10°E | 914 | 509 | 501 | 8 | 2.50 | 0.81 | -0.21 | 2.60 |
| WBI_01C3_14LST | ESRL | West Branch, Iowa, United States | 41.72°N | 91.35°W | 242 | 1197 | 1134 | 63 | 3.00 | 1.81 | 0.37 | 3.77 |
| WBI_01P0 | ESRL | West Branch, Iowa, United States | 41.72°N | 91.35°W | 242 | 862 | 795 | 67 | 3.00 | 2.07 | 0.22 | 4.18 |
| WGC_01C3_14LST | ESRL | Walnut Grove, California, United States | 38.27°N | 121.49°W | 0 | 1091 | 1021 | 70 | 3.00 | 1.68 | -0.10 | 4.29 |
| WGC_01P0 | ESRL | Walnut Grove, California, United States | 38.27°N | 121.49°W | 0 | 891 | 748 | 143 | 3.00 | 3.67 | -0.67 | 6.51 |
| WIS_01D0 | ESRL | WIS Station, Negev Desert, Israel | 31.13°N | 34.88°E | 400 | 540 | 537 | 3 | 2.50 | 0.61 | 0.03 | 1.94 |
| WKT_01C3_14LST | ESRL | Moody, Texas, United States | 31.31°N | 97.33°W | 251 | 2117 | 2100 | 17 | 3.00 | 0.65 | 0.14 | 2.29 |
| Site code | Lab. | Location | Latitude | Longitude | Elev. (m ASL) | No. Obs. Avail. | No. Obs. Used | No. Obs. Rej. | r (μmol mol-1) | Innov. χ2 | Bias (μmol mol-1) | SE (μmol mol-1) |
| WKT_01P0 | ESRL | Moody, Texas, United States | 31.31°N | 97.33°W | 251 | 993 | 979 | 14 | 3.00 | 0.94 | -0.10 | 2.85 |
| WLG_01D0 | ESRL | Mt. Waliguan, Peoples Republic of China | 36.29°N | 100.90°E | 3810 | 427 | 413 | 14 | 1.50 | 1.12 | 0.13 | 1.91 |
| WSA_06C0_14LST | EC | Sable Island, Nova Scotia, Canada | 49.93°N | 60.02°W | 5 | 2358 | 2259 | 99 | 3.00 | 1.17 | 0.17 | 4.12 |
| ZEP_01D0 | ESRL | Ny-Alesund, Svalbard, Norway and Sweden | 78.90°N | 11.88°E | 475 | 568 | 566 | 2 | 1.50 | 0.96 | 0.55 | 1.22 |
| All-site summary | | | - | - | - | 85153 | 83910 | 1243 | - | 0.73 | 0.06 | 2.70 |
|
|
