NOAA's Annual Greenhouse Gas Index (An Introduction)
The Issue –
Increasing concentrations of greenhouse gases in Earth’s atmosphere represent a
long-term commitment by society to living in a changing climate and, ultimately,
a warmer world ( IPCC, 2014, Working Group I)
The Problem –
Climate change has disruptive and uncertain consequences for agriculture,
water supply, transportation, coastal communities, the economy, energy, ecosystems,
and national security (IPCC, 2014, Working Group II)
The Question –
How much is the human influence on climate changing, owing to continued emission of greenhouse gases?
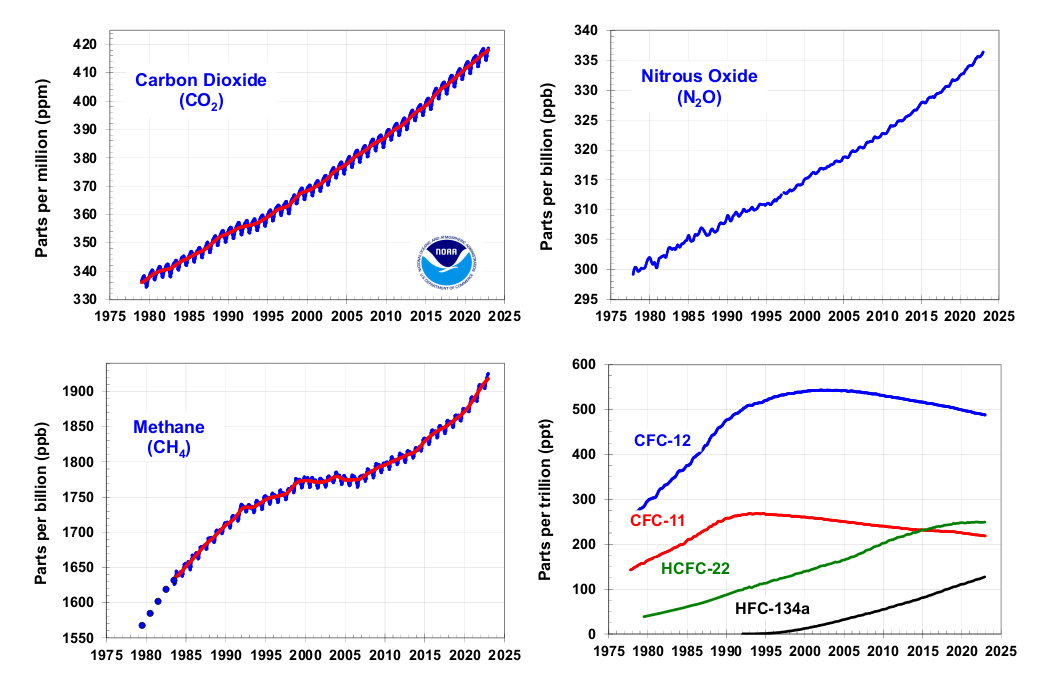
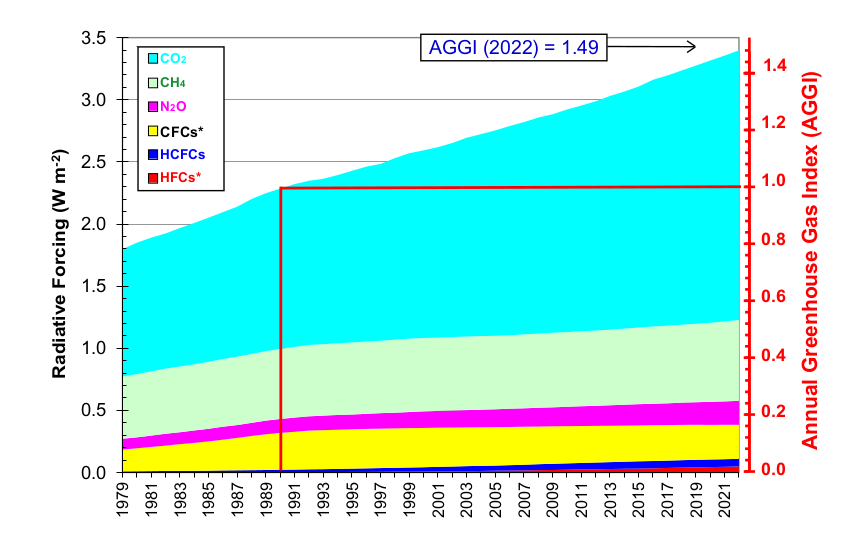
The NOAA Annual Greenhouse Gas Index (AGGI) tracks the increasing amount of heat being added to the atmosphere by human-related greenhouse gas (GHG) emissions. It is based on the highest quality measurements of GHGs in the atmosphere from sites around the world. Its uncertainty is very low.
The AGGI is analogous to the dial on an electric blanket. Just as
the dial does not tell you exactly how hot you will get, the AGGI
does not predict how much Earth’s climate will warm. You do know,
however, that if the dial is turned up a little, the blanket will
get warmer – and not immediately. If you turn it up a lot,
you know the blanket will get a lot warmer – eventually.
Of course, the Earth System is more complicated than an electric blanket
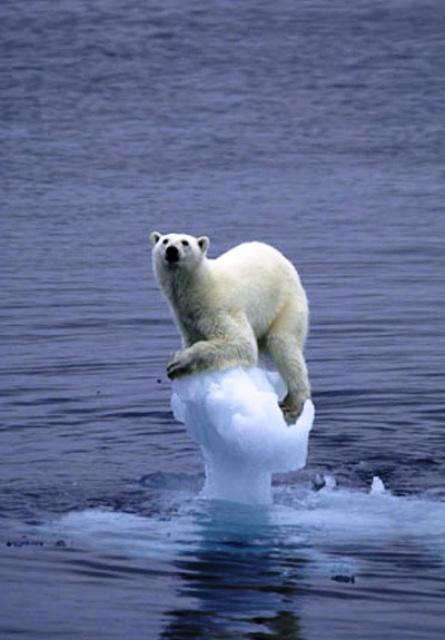
and climate change is expressed in many ways – e.g., drought,
increased temperatures, altered storm patterns and precipitation rates,
increased glacier melting, etc.
But each year the increasing AGGI reminds us that our on-going emission
of long-lived greenhouse gases results in more of the sun’s heat being
trapped in the Earth system. In essence, we continue to increase the
setting on Earth’s “thermostat” by a small amount every year.
So, how much did the warming influence from GHGs increase last year?
How does that compare with previous years?
What gases contribute most to the change each year?
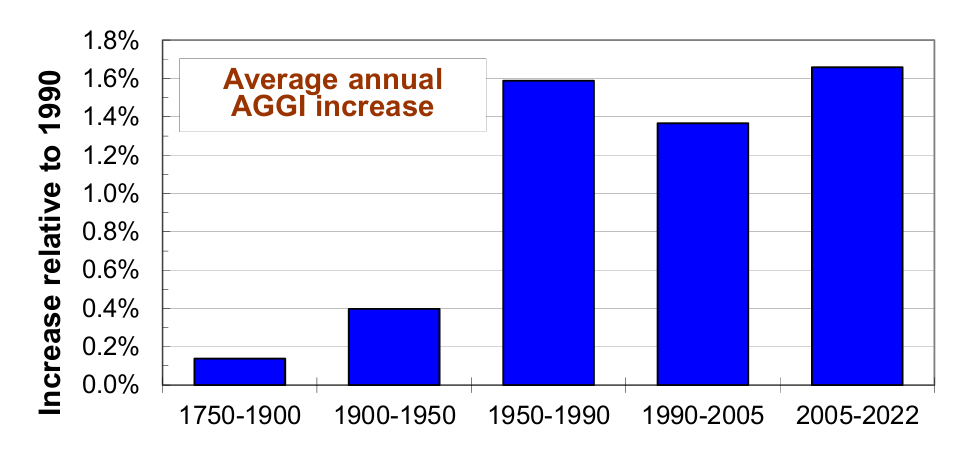
From 2021 to 2022 the dial increased another 1.8% relative to 1990 levels,
a rate that has been sustained for many years.
In a nutshell:
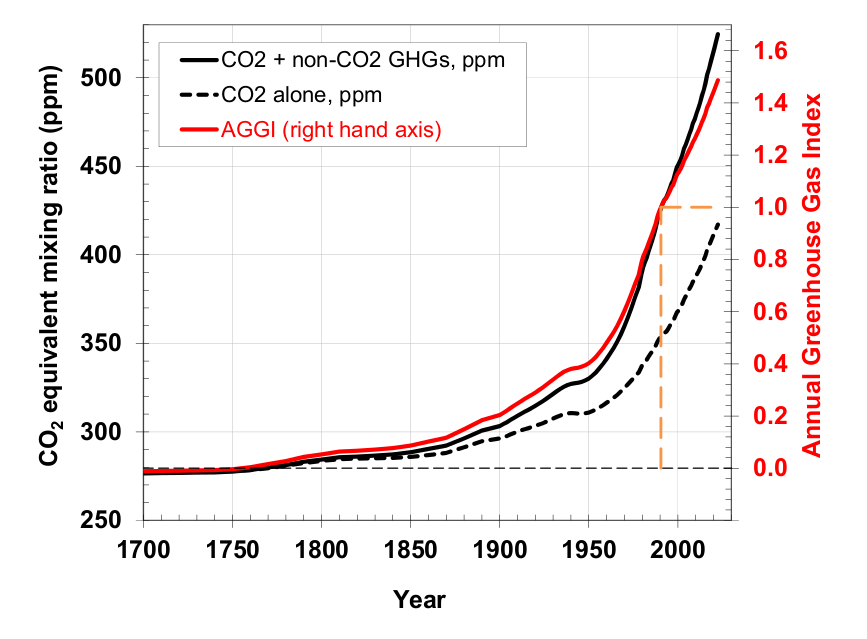
The AGGI in 2022 was 1.49, which means that we’ve turned up the warming influence from greenhouse gases by 49% since 1990.
It took ~240 years for the AGGI to go from 0 to 1, i.e., to reach 100%, and 32 years for it to increase by another 49%.
In terms of CO2 equivalents, the atmosphere in 2022 contained 523 ppm, of which 417 is CO2 alone. The rest comes from other gases.
CO2 is by far the largest contributor to the AGGI in terms of both amount and rate of increase.
Note: The IPCC suggests that a constant concentration of CO2 alone at 550 ppm would lead to an average increase in Earth’s temperature of ~3°C (5.4°F).