
Particle Sizing Instrumentation
We have collaborated with scientists outside NOAA to deploy size distribution instruments which classify particles based on their mobility diameter. These instruments scan through a range of sub-micron mobility diameters (typically between 0.01-0.7 um) to measure the particle size distribution.
Tandem Nephelometer Humidograph
A scanning humidification/drying system is used to step the air stream through a range of humidities for sampling by a second 'humidified' nephelometer. This provides information on the hygroscopicity of the aerosol by recording the scattering coefficient at different realtive humidities. Burgos et al., (2019) describes various designs for tandem nephelometer humdiograph system. Below we describe the NOAA design.
The humidifier is an annular design consisting of a counterflow water stream around a water vapor permeable membrane stretched on a wire mesh tube. The aerosol air stream flows thru the wire mesh tube. The controlled temperature of the water determines the RH to which the airstream is exposed.
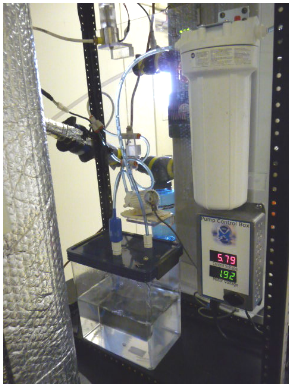
The aerosol humidifier consists of two concentric tubes. Water circulates between the inner and heated outer tubes. The inner tube is a porous PTFE material that transmits water vapor. The humidifier is used as part of a system to measure the aerosol hygroscopic growth (fRH) or increase in the aerosol scattering coefficient with relative humidity. The humidifier continuously scans the relative humidity from about 30 to 85%. The photo to the left shows the system at SGP. Water circulates from a water reservoir through a small solenoid pump, flow-regulating valve, the humidifier and back through a float valve, filter and into the reservoir.
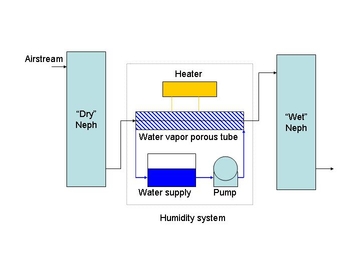
The humidifier is an annular design consisting of a counterflow water stream around a water vapor permeable membrane. In earlier versions of the humidifier this membrane was stretched on a wire mesh tube. Newer iterations of the humidifier utilize a semi-rigid, shape-maintaining membrane, eliminating the need for the wire mesh. The aerosol air stream flows thru the membrane. The controlled temperature of the water determines the relative humidity to which the air stream is exposed. A detailed description of the most recent version of the humidifier can be downloaded here (pdf file).
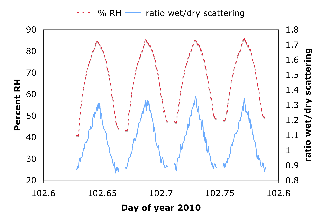
This graph shows four hours of humidograph data from SGP. The RH (dashed red line) scans the RH up and down every hour. The blue line shows the ratio of the wet/dry scattering coefficients. The first half hour is sub 10 micron size aerosol and the 2nd half hour is sub micron size aerosol.
Hygroscopic Growth
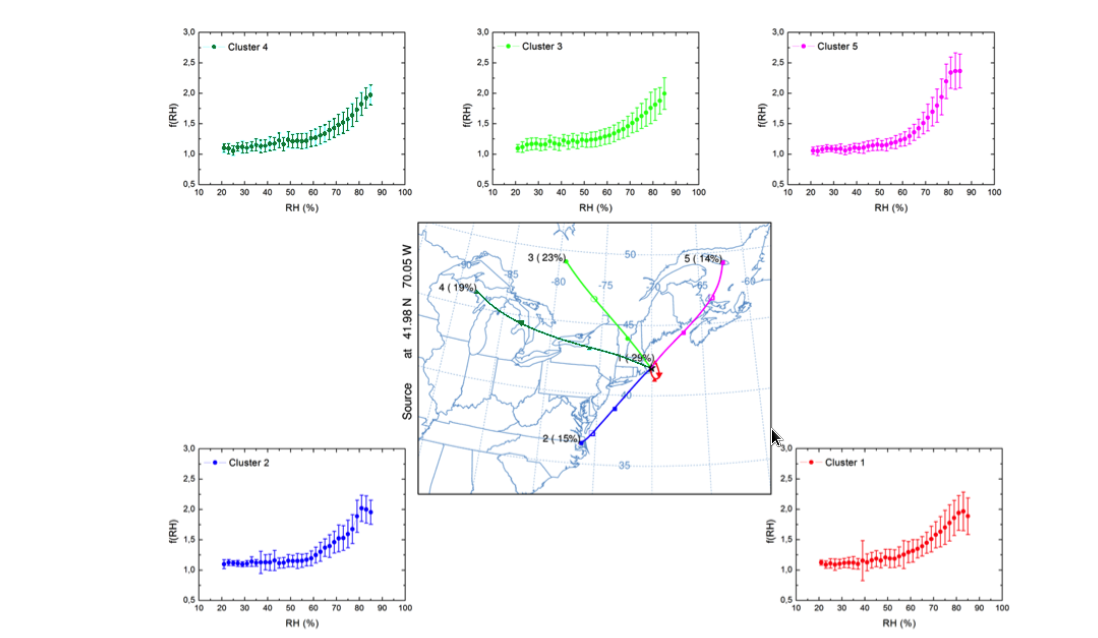
The humidified nephelometer system allows us to look at the value of light scattering as a function of relative humidity (RH). To be able to compare how this indicator of hygroscopic growth changes for different types of aerosol (e.g., dust, smoke, sea salt, or pollution) we normalize the wet scattering using the scattering at low humidity to derive the dimensionless parameter 'f(RH)'. We define f(RH) as the ratio of light scattering at 85% humidity to the scattering at relative humidities < 40%. (Other research groups use slightly different values relative humidity in their definitions of f(RH). Some examples of how f(RH) changes as a function of humidity, air mass source region and other aerosol optical properties are available for multiple sites (e.g., Titos et al., 2016 and Burgos et al., 2019). It has also been studied for individual NFAN sites: Bondville (unpublished analysis) and Southern Great Plains (from Sheridan et al., 2001) and Cape Cod (from Titos et al., 2014). Hygroscopic growth observations have proven useful in evaluating global model simulations of aerosol/water interactions (Burgos et al., 2020).
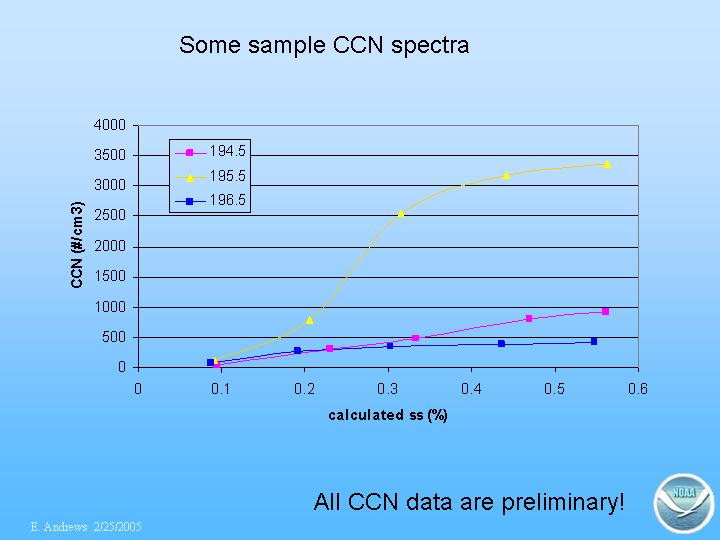
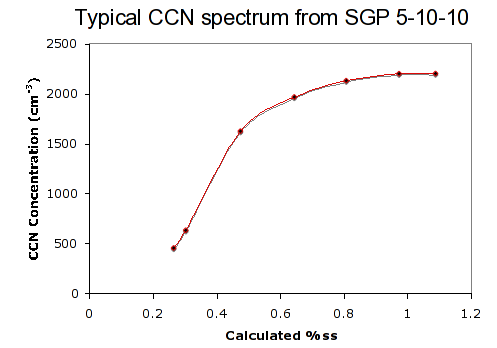
Cloud Condensation Nuclei (CCN) Counter
A DMT cloud condensation nuclei counter (CCN) is used to count the number of particles which activate at a specific super-saturation. A wetted column provides the super-saturations and the particles are counted by an optical particle counter.
The CCN instrument consists of a vertical column with wetted walls which provides the water vapor necessary to produce super-saturations. Particles activate into droplets when exposed to the super-saturated conditions. An optical particle counter measures the resulting droplet size distribution. The CCN at several supersaturations is measured using a DMT CCN counter (Roberts and Nenes, 2005). The percent supersaturation (%SS) of the instrument is stepped in 7 intervals every 30 minutes with 5 minutes at each setting in a pyramid form. We use a heat transfer and fluid dynamics model flow model to calculate the %SS (Lance et al., 2006). The model uses the calibrated temperature, pressure and flows in the instrument to calculate the %SS.
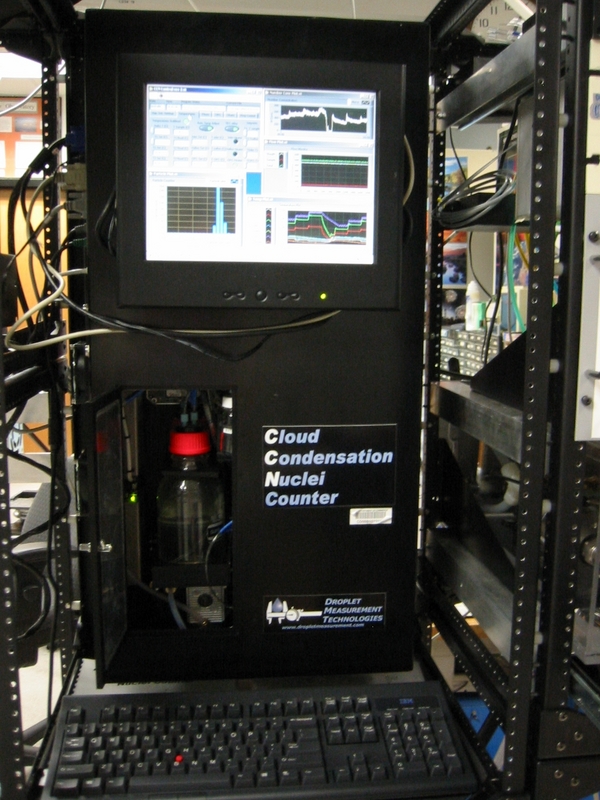
Our CCN instrument comes from Droplet Measurement Technologies (DMT) in Boulder, CO.
- Lance, S., J. Medina, J. N. Smith, and A. Nenes, Mapping the operation of the DMT continuous flow CCN counter, Aerosol Sci. Technol., 40(4), 242–254, 2006.
- Roberts, G., and A. Nenes , A continuous-flow streamwise thermal- gradient CCN chamber for atmospheric measurements, Aerosol Sci. Tech- nol., 39(3), 206–221, 2005.
Chemistry Measurements
At several sites, an automated filter carousel has been used to collect chemical filter samples every 24 hours. There are 8 filters on the carousel - one for each day of the week and a field blank. The filters are changed once a week in a glove box and sent to the Pacific Marine Environmental Labs for major ion analysis and total gravimetric mass by Patricia Quinn's group. At one site (BRW) the filter carousel was modified for organic aerosol sampling. This was a collaboration with Lynn Russell at Scripps
Additional Photos of Filter Rack
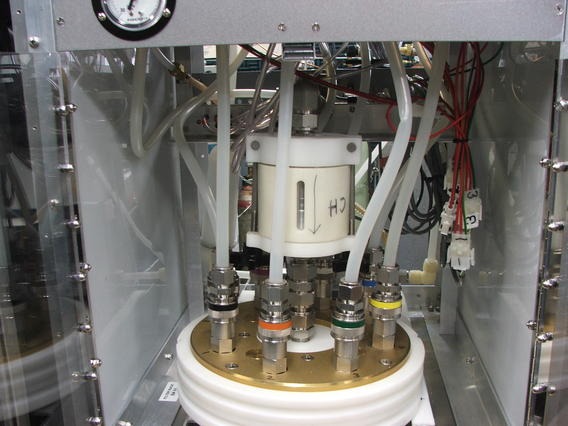
This is a close up of the filter carousel in the filter rack. The sample air goes through the large white impactor in the center of the picture (impactor is made of stainless steel, but has protective plastic cover), through the carousel (bottom center) and then to the active filter. The tubes exiting the carousel and going toward the top of the picture are the vacuum tubing. Vacuum to the individual filters is controlled by a set of 8 solenoids (not shown).
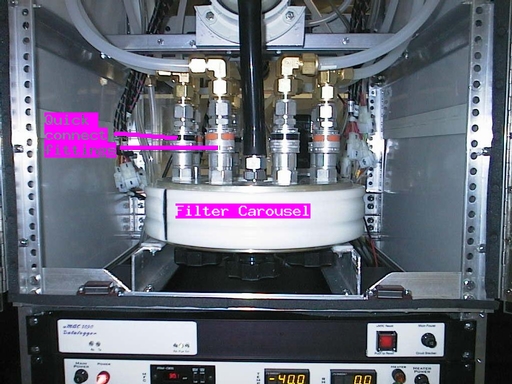
The filter rack consists of a filter carousel with 8 filters. Seven of the filters are operated consecutively over a 24 hour time period in order to obtain daily chemistry samples, one for each day of the week. The eighth sample serves as a field blank. Quick-connect fittings are used to make the weekly filter changing easier for field operators.
Counterflow Virtual Impactor (CVI)
At various field campaigns the Aerosol group has used a separate, co-located CVI inlet to study interactions between aerosol particles and cloud/fog droplets. The CVI preferentially enhances the measurement of cloud droplets, while repelling smaller interstitial aerosol from the sample air stream.