LLLJP Data Comparison: HRDL (vertical-slice scans) / sodar
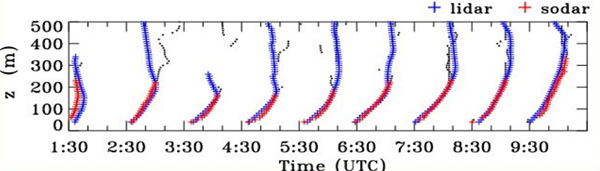
Profiles of 10-min lidar horizontal velocity (blue) and 10-min sodar wind speed profiles (red), for every hour during the night of September 15. Black dots show all available sodar data, red pluses are sodar data obtained with confidence factor 3 or more. The range of the wind speed within each time interval is 5-20 m s -1.
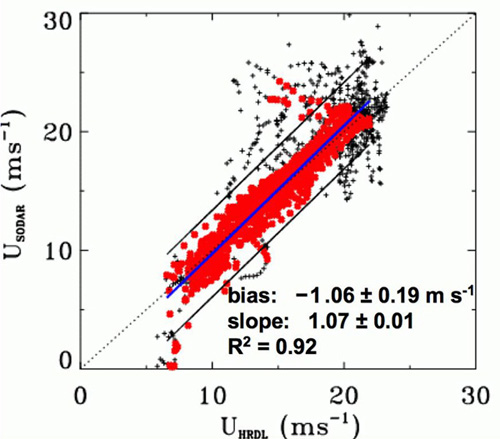
Scatter plot of data of lidar and sodar data as in top plot. The middle line in the plot represents the best-fit linear regression and the upper and lower lines are for ±1 standard deviation. Correlation statistics were computed only for high-confidence sodar measurements, which are shown by large red pluses.