R/V Ronald H. Brown Daily Summaries
Daily Summary July 16, 2002, DOY = 197
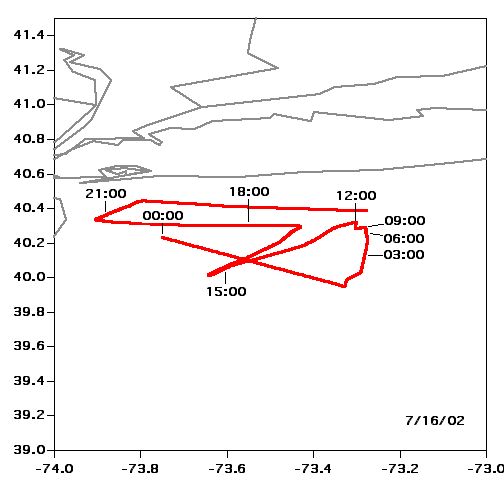
The meteorology was dominated by a weak cold front that passed during the early morning. The wind during the period was initially from the north-northwest diminishing and slowly turning during the day to the west. The ship track was designed to map slightly aged pollution from New York City and the surrounding area. The cruse commenced for the day at a point approximately 30 nautical miles east southeast of the Ambrose Light. During the day the ship proceed in a zigzag path toward the Light. At 1800 EDT, the ship entered the eastbound Ambrose Light Nantucket shipping lane and proceed to the east beginning the transit to the Gulf of Maine.
Several pollution plumes were encountered during the night. These plumes contained evidence of the importance of nighttime chemistry. Substantial concentrations of NO3 (up to 50 ppt) and NO2O5 (up to 200 ppt) were observed. The concentrations of NO3 and N2O5 were accompanied by enhanced levels of nitric acid (up to 500 ppt) and nitrate aerosols presumably produced by the reactions of NO3 with VOCs. Oxidized hydrocarbons and PAN produced by this nighttime chemistry were also observed. During the day, pollutions plumes from the mainland appeared to be generally dispersed over the region. The concentration of ozone measured by the lidar appeared to be reasonably constant throughout the lowest 2 kilometers of the atmosphere with levels reaching 70 ppb. NOy levels measured aboard the ship varied between 8 ppb and 20 ppb while CN levels varied between 5000 per cc and 20000 per cc. However, near the final turning point the CN level went above 50000 per cc with no apparent increase in NOy or aerosol scattering. Very small organic aerosols dominated the aerosols distribution at this time.
The DOE G1 aircraft flew over the Ronald H. Brown at 15:00 EDT on its return from sampling over the Delaware area. Communication between the ship and the aircraft indicated that both platforms were see similar concentrations of gaseous pollutants.
For all plots, time is indicated in GMT. Eastern time is -5 hours.
 Location |
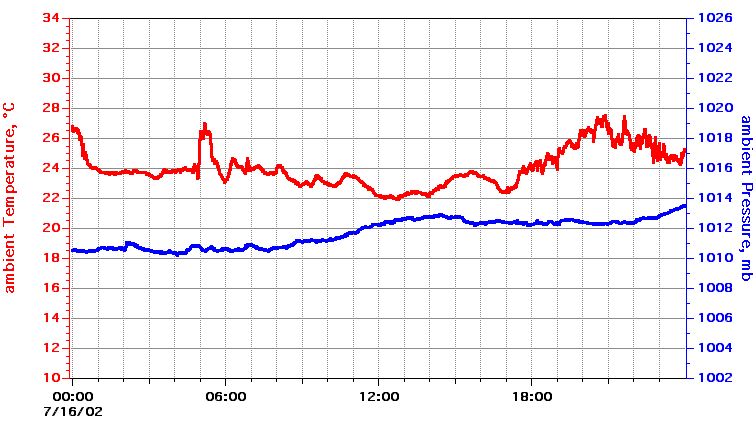 Temperature, Pressure |
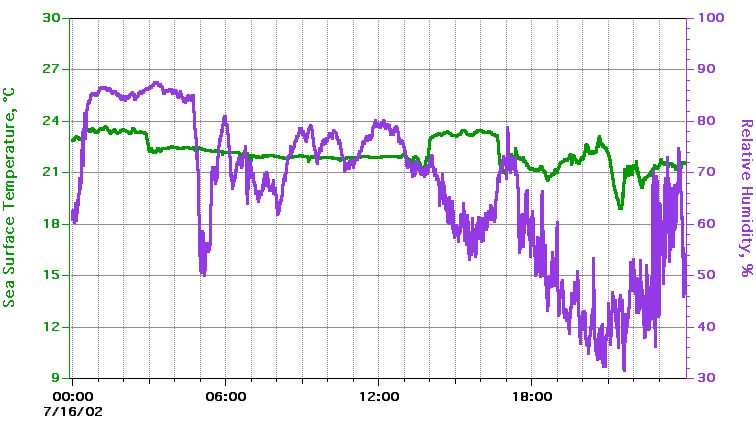 >Sea Surface Temperature, Relative Humidity |
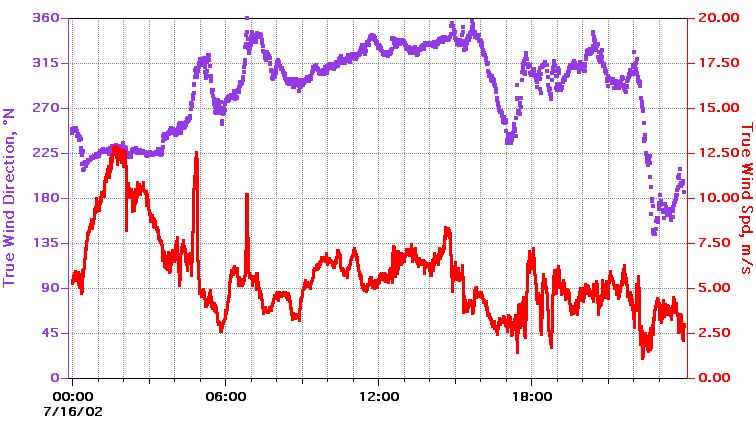 True Wind Speed, Direction |
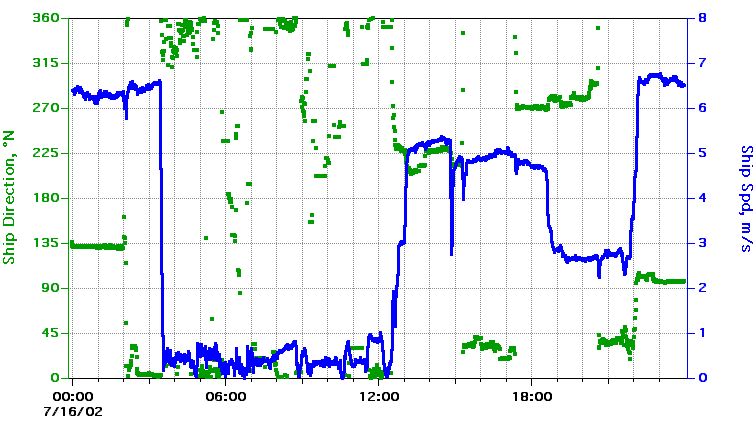 Ship Speed, Direction |
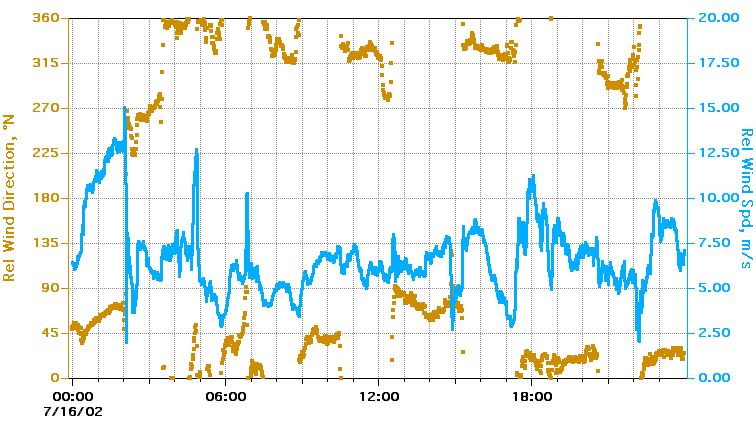 Relative Wind Speed, Direction |
Textual information and data plots are for quicklook and overview purposes only.